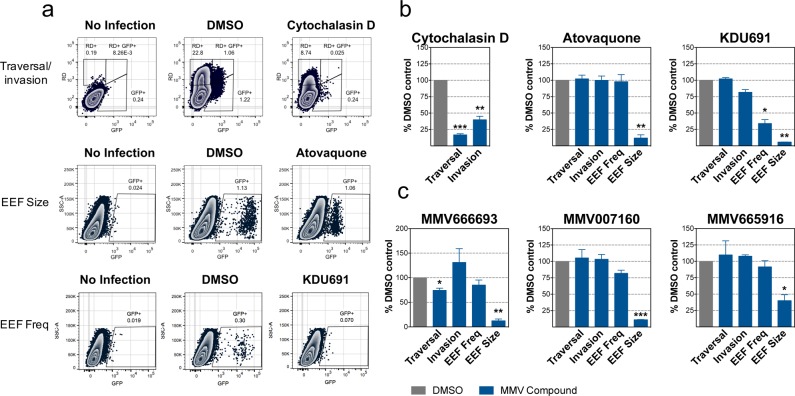
Figure 6.
Validation of exoerythrocytic-stage activity using an established flow-cytometry-based assay. (a) Flow cytometry plots measuring traversal and invasion (at 2 h postinfection) and EEF frequency and development (at 48 h postinfection) of exoerythrocytic-stage malaria parasites in Huh7.5.1 cells as previously described for three of the most potent compounds. Cytochalasin D was used as a positive control for traversal and invasion; KDU691 was used as a positive control for EEF frequency, and atovaquone was used as a positive control for EEF frequency and development. While traversal was measured by the percentage of rhodamine–dextran single-positive cells, invasion was measured by the percentage of Pb-GFP single-positive cells at 2 h postinfection. At 48 h postinfection, EEF frequency was measured by the percentage of Pb-GFP-positive cells, and EEF development was measured by the relative mean fluorescence intensity (MFI). Representative flow cytometry plots are shown. Atovaquone was tested at 1 μM (due to slight cytotoxicity at 10 μM in Huh7.5.1 cells, Figure S4), and cytochalasin D and KDU691 were tested at 10 μM. (b) Mean and SEM are shown graphically from the traversal/invasion, EEF frequency, and EEF size control experiments shown in panel (a) (cytochalasin D, atovaquone, and KDU691, respectively). Values are normalized to the DMSO control. (c) Exoerythrocytic-stage traversal, invasion, EEF frequency, and EEF development are shown for MMV666693, MMV007160, and MMV665916. Mean and SEM from three replicate experiments are shown. MMV66693 was tested at 1 μM (due to slight cytotoxicity at 10 μM in Huh7.5.1 cells, Figure S4), and MMV007160 and MMV665916 were tested at 10 μM.

