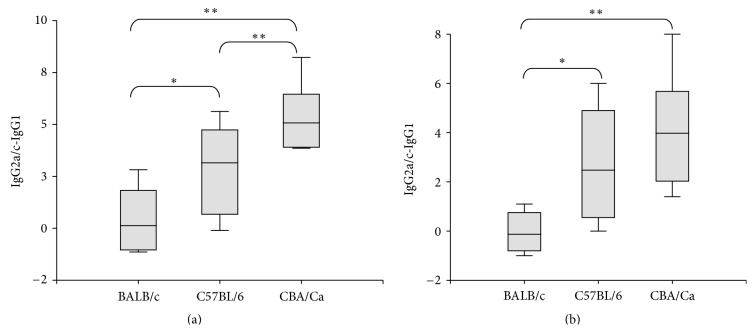
Figure 4.
Difference between IgG2a or IgG2c and IgG1 levels in postinfection sera. (a) Infection dose of 1 × 10⁶ tachyzoites. (b) Infection dose of 5 × 10⁶ tachyzoites. ∗Indicates a statistically significant difference between the groups (P < 0.05). ∗∗Indicates a highly significant difference between the groups (P < 0.01).

