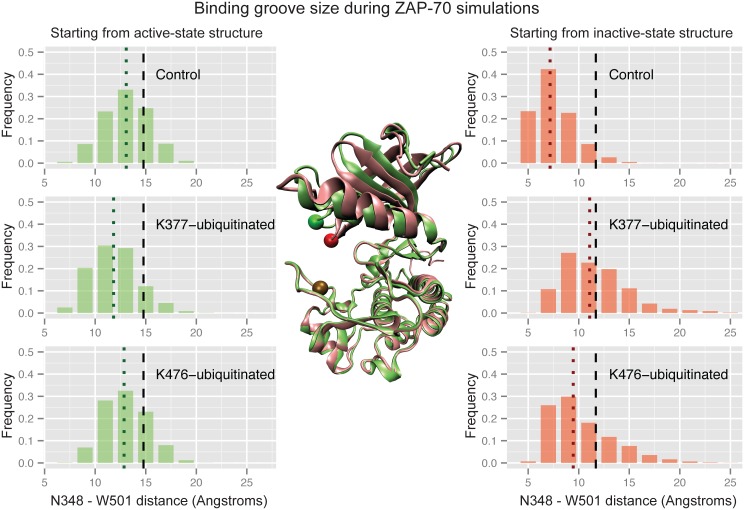
Fig 7. Ubiquitination affects ZAP-70 groove closure.
Histograms of the distance between the N348 Cα atom and the W501 Cα atom during three sets of ZAP-70 simulations; control simulations, K377-monoubiquitinated, and K476-monoubiquitinated, both started from the active state structure (left) and the inactive, autoinhibited structure (right). The vertical dashed black lines indicate the distance observed in the starting crystal structure, while the dotted colored lines indicate the median value for each histogram. The histogram is created from combining all structures sampled in each of the 32 independent simulations with snapshots every picosecond. In the center, residues N348 and W501 are shown as spheres on the overlaid ZAP-70 active (green) and inactive (red) crystal structures.

