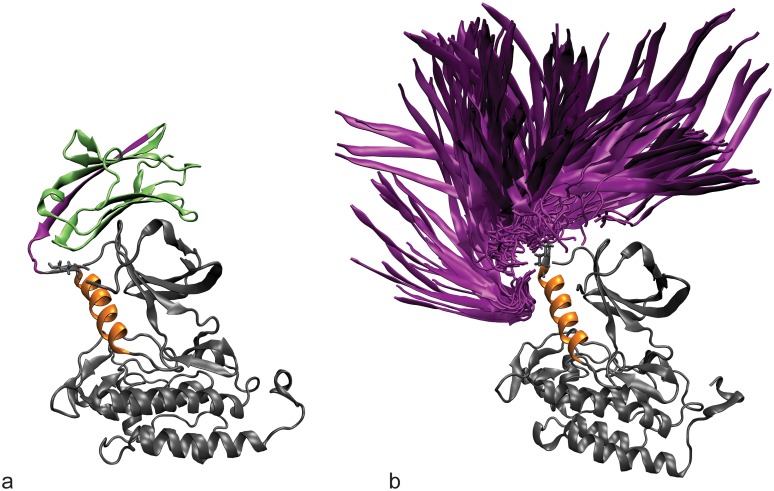
Fig 9. Ig domain sampling.
(a) The starting structure for simulations of the active ZAP-70 kinase with an Ig domain attached at K377. The C-helix is shown in orange and the Ig domain molecule is shown in green. The C-terminal β-strand of the Ig domain is highlighted in purple. (b) The diversity of orientations that the Ig domain samples, starting from the K377 active structure with Ig domain attached, is summarized by showing only the orientation of the C-terminal β-strand (purple) relative to the kinase, for snapshots separated by 1 ns.

