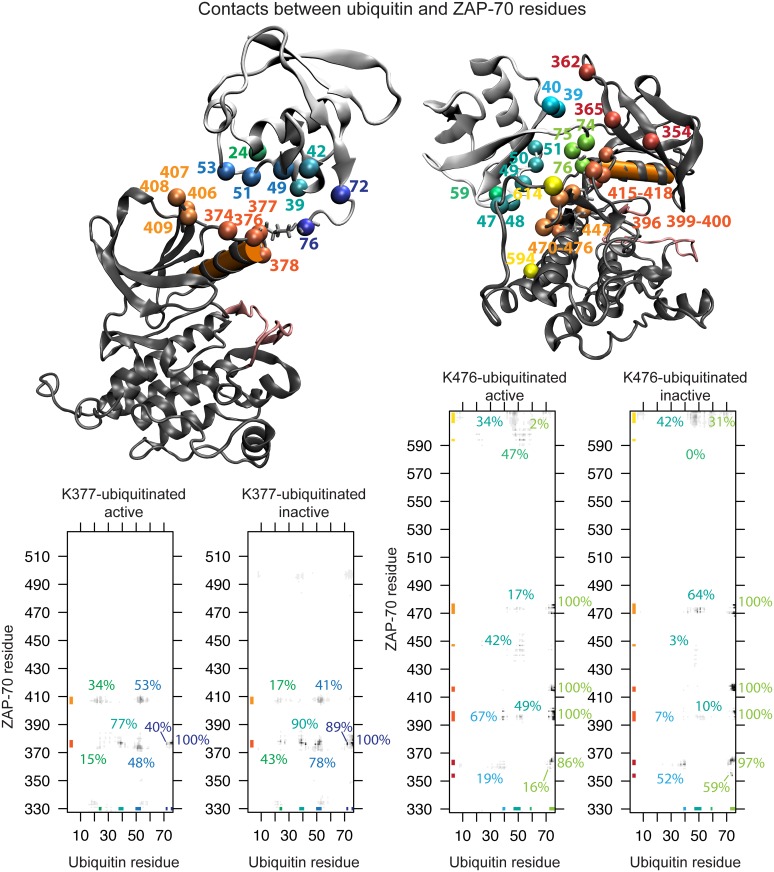
Fig 11. Ubiquitin-ZAP-70 contacts.
Contact maps showing the ZAP-70 sequence vs. the ubiquitin sequence for K377 ubiquitination starting from the active-state structure and inactive-state structure, and K476 ubiquitination starting from the active-state structure and inactive-state structure. The darkness of the pixel indicates the percent of snapshots from the simulation where these two residues are in contact. A contact is defined as a distance of less than 10 Å between residue centers of mass. In the ubiquitinated structures shown above, the residues that are frequently involved in contacts are colored and labeled, both on ubiquitin and ZAP-70. The ubiquitin moiety is shown in white, while the ZAP-70 structure is shown in dark gray. The corresponding colors are shown next to the axes on the contact maps. The contact regions with the highest frequency are also labeled with their frequencies on the contact maps. The color of these labels corresponds to the color of the ubiquitin residues involved.

