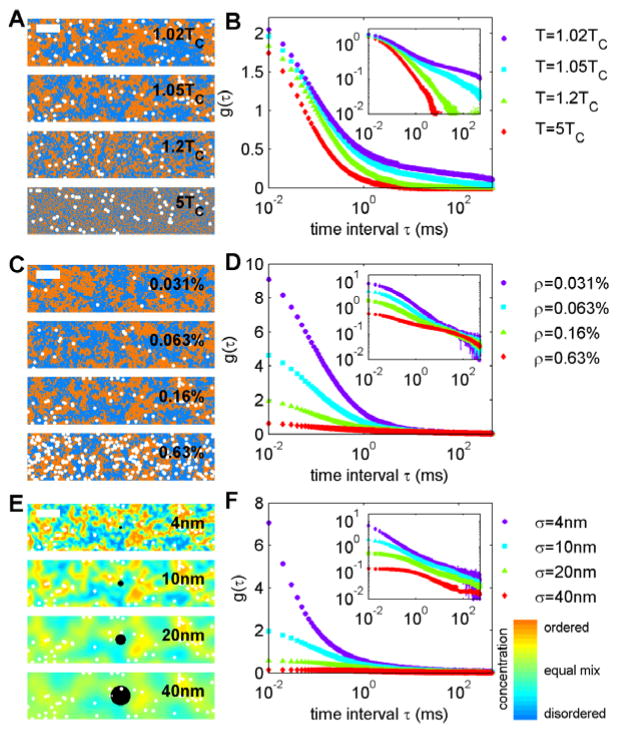
Figure 2. Correlation functions of tracers in the Ising model vary with temperature and tracer density.
(A) Representative snap-shots of simulations conducted at the temperatures indicated and at fixed tracer density (ρ=0.16%). White tracers are a subset of orange pixels and are drawn larger than the pixels themselves for demonstration purposes. (B) Aggregate g(τ) curves for the temperatures and tracer density in A at a fixed spot area (corresponding to σ=10nm). Intensity at large τ becomes more pronounced at lower temperatures when composition fluctuations are large and long-lived. (C) Representative snap-shots of simulations conducted at fixed temperature (1.05×TC) and varying tracer density as indicated. Aggregate g(τ) curves for the temperature and tracer densities in C at a fixed spot area (corresponding to σ=10nm). Intensity at short τ depends strongly on tracer density, but all curves decay to the same long τ behavior within signal to noise. (E) Snapshot of T=1.05×TC and ρ=0.16% blurred with different Gaussian filters with standard deviations (σ) between 4 and 40nm. This represents the image that would be acquired with this beam size if the structure was static and if all ordered and disordered components were labeled. The color bar at right indicates density (orange = all ordered components; blue = all disordered components). Black circles have a radius of σ. (F) Aggregate g(τ) curves for simulations shown in E. The long τ tail of curves are not largely effected by the PSF size until σ exceeds the correlation length (ξ=20nm under these conditions). In B, D, and E the inset contains the same data plotted on a log-log scale.

