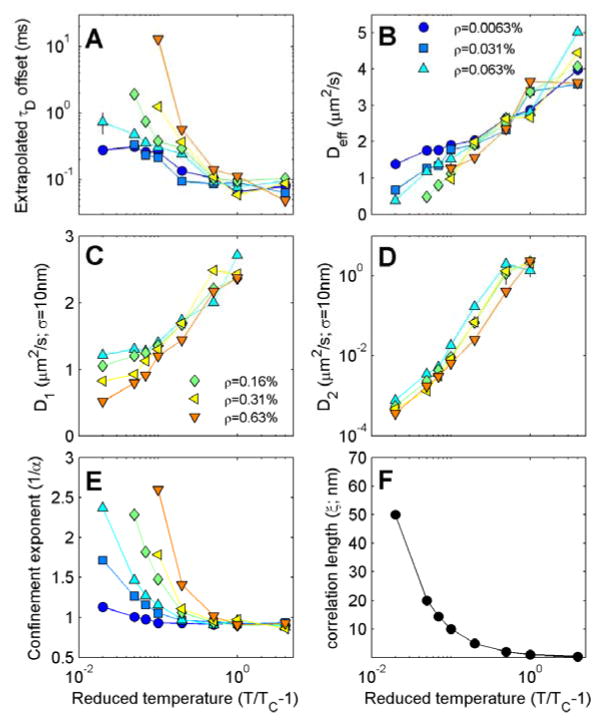
Figure 4. Summary of svFCS fit parameters in the 2D Ising model.
(A) Extrapolated Y intercepts obtained by fitting plots of τD vs area, for areas between 5.6×10³ and 1.6 ×10⁴ nm2 where τD is obtained by fitting to Eqn 3. (B) Effective diffusion coefficients (Deff) defined as the inverse slope divided by 4 of the line described for part A. (C,D) Diffusion coefficients associated with the best fit values of τD1 (C) and τD2 (D) for σ=10nm (area = 630nm2) as determined from Eqn 4. (E) The inverse of the best fit value for the confinement exponent α as determined from Eqn 5.The value presented is an average over all areas. The legends in B,C apply to points in panels A–E and conditions are plotted only for instances where correlation functions and fits are well specified. (F) The characteristic size of composition fluctuations as a function of reduced temperature. For all temperatures probed, this correlation length is much smaller than the dimensions of the simulation box (800×800nm).

