
Figure 5. 2D Ising model simulations can qualitatively resemble experimental findings.
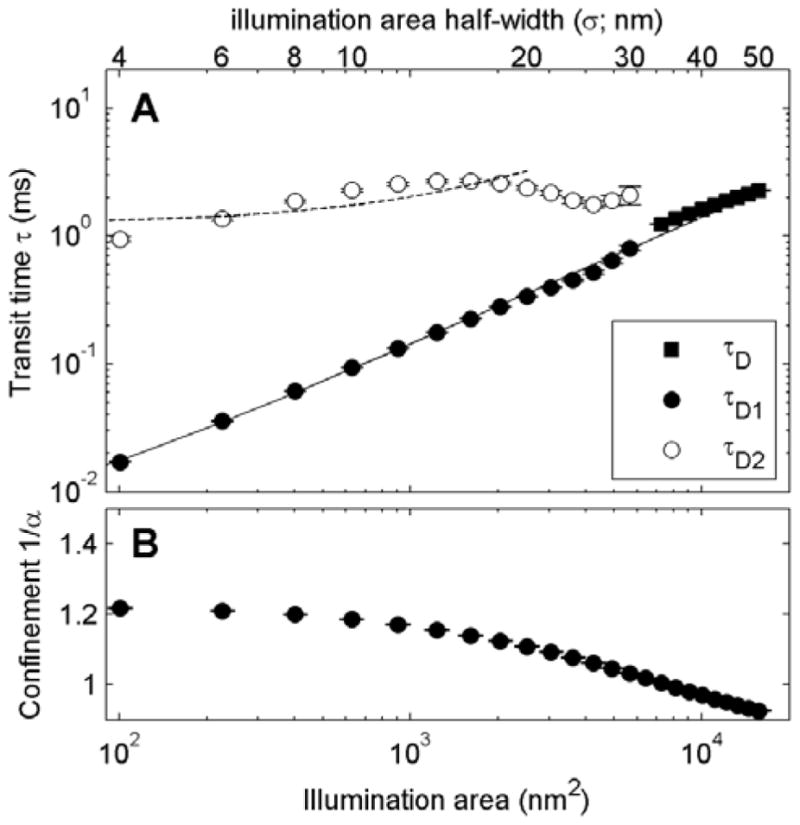
(A) Plot of transit times obtained by fitting either Eqn 3 or Eqn 4 to g(τ) tabulated from Ising model simulations conducted at 1.2Tc and ρ=0.16%. g(τ) tabulated using larger illumination areas are well fit with a single transit time (τD), while smaller illumination areas are better described using two distinct transit times τD1 and τD2. (B) Best fit confinement exponents α determined by fitting the same g(τ) in (A) to Eqn 5. Curves suggest greater confinement (1/α) is apparent at smaller illumination areas. Plots compare qualitatively to Figure 3 in [18].