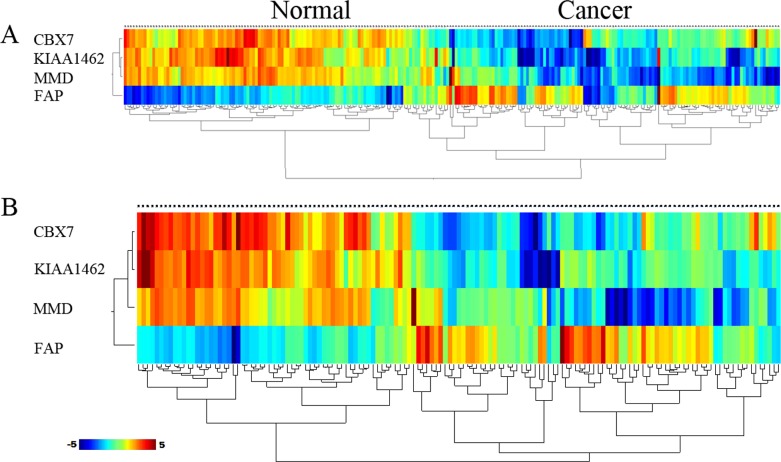
Figure 5. Hierarchical clustering analysis of two sets based on 4 core genes was performed using samples from (A) training set and (B) testing set.
The relative level of gene expression is indicted by the color scale at the bottom word “c” on the each clustering plot represent cancer sample. Word “n” on each clustering plot represent control sample.

