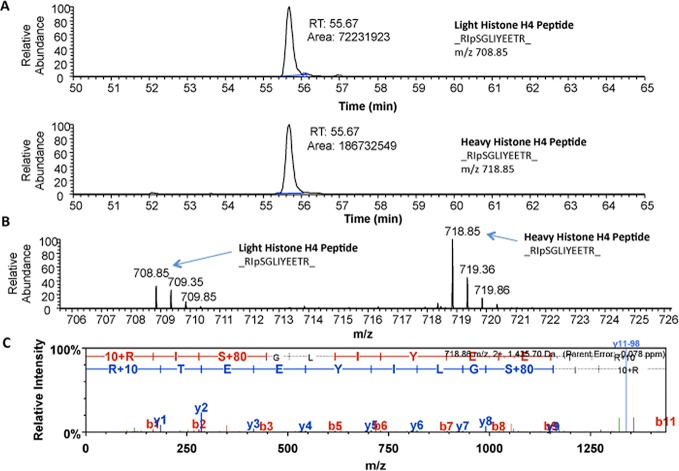
Figure 2. Mass spectrometry identified increased phosphorylation of Histone H4 at Ser47 in B103-695 cells.
A. Extracted Ion Chromatogram for “Light” (top) and “Heavy” (bottom) Histone H4 peptide RpSGLIYEETR. B. Base peak chromatogram showing isotope clusters for both “Light” and “Heavy” peptides with monoisotopic masses labelled. C. Annotated MS/MS spectra of Histone H4 peptide showing phosphorylation detected at Ser47.

