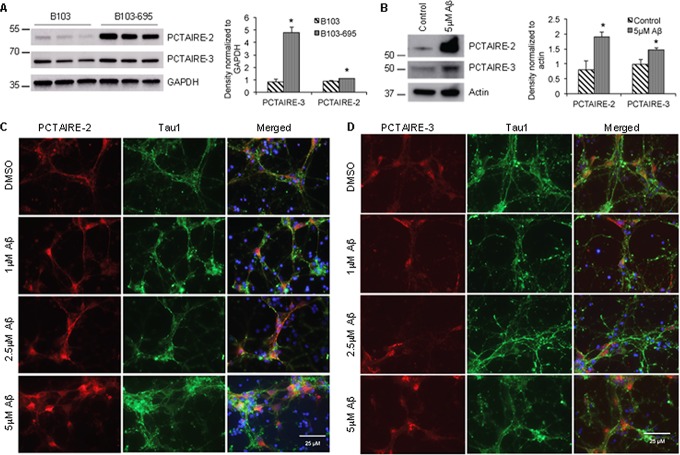
Figure 4. APP expression and Aβ treatment increase the levels of PCTAIRE-2 and PCTAIRE-3 in cells.
Western blot analysis shows that PCTAIRE-2 and PCTAIRE-3 are significantly increased in A. B103-695 cells compared to B103 cells and B. primary neurons treated with Aβ compared to vehicle treated controls. The bar graphs to the right of the blots show data normalized to GAPDH levels in B103 and B103-695 cells and actin in primary neurons. *p value < 0.05. C. and D. Primary cortical neurons were treated with or without 1, 2.5 and 5 μM Aβ for 24 hr and co-immunostaining analysis was performed using (C) PCTAIRE-2 or (D) PCTAIRE-3 and Tau1 antibodies. Hoechst was used to visualize the nuclei. Neurons treated with Aβ show increased nuclear and perinuclear staining.

