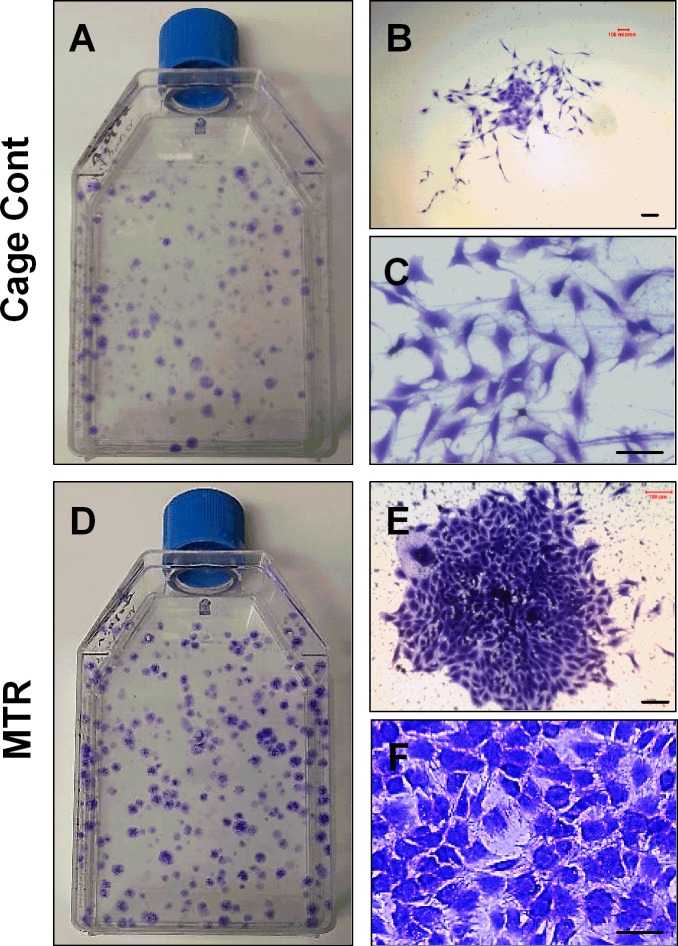
Figure 6. MTR increases the colony number and colony size of TSCs from aging rat patellar tendons.
A., B., C. - TSCs from control aging rats; D., E., F. - TSCs from aging rats after MTR. The number of colonies in control aging rats A. is much smaller than those in aging rats after MTR regimen D.. The number of cells per colony was also lower in the control group B., C. than MTR group E., F.. Note that the cells in MTR group F. are cobblestone shaped, the typical shape of “authentic” TSCs, while many cells in cage control group C. are spindle shaped. Bars: 100 μm.

