
Figure 11. The specific core GEN of old women as determined by the distinction between the core GEN of old women and men.
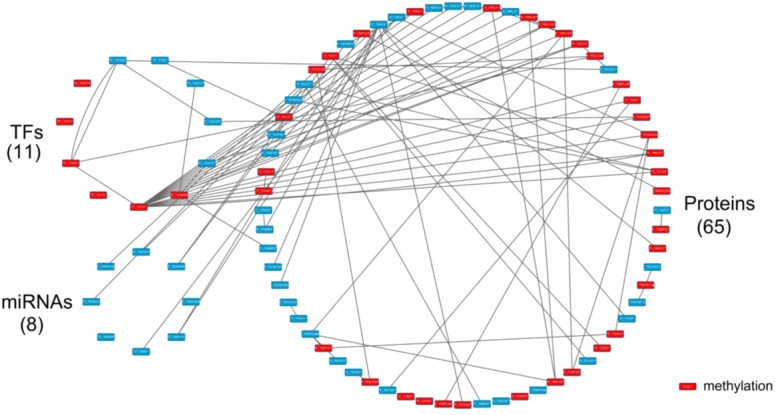
The upper left circle represents the TFs (11), the lower left circle represents the miRNAs (8) and the right circle represents the proteins (65) for the specific core GEN of old women. The red nodes represent DNA methylation of genes. Links within the “proteins” circle represent the significant PPIs, links between the “TFs” circle and the “proteins” circle represent significant regulation of TFs on target genes and links between the “miRNAs” circle and the “proteins” circle represent significant regulation of miRNAs on target genes in the specific core GEN of old women.