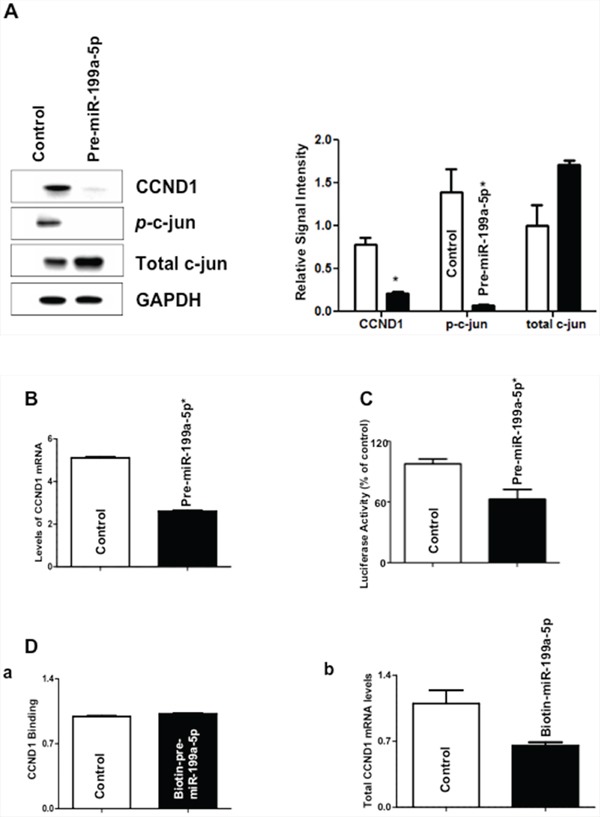
Figure 7. Effect of miR-199a-5p modulation on levels of c-jun and cyclin D1 (CCND1).

A. Forty-eight hours following transfection with pre-miR-199a-5p (10 nM) or control miR, whole cell lysates were isolated and subjected to western blot analysis with indicated antibodies. Changes in levels of cyclin D1, phosphorylated c-Jun, and total c-Jun protein expression are depicted in the immunoblots. The adjacent bar diagrams for relative protein signal intensity are the mean signal intensity of three separate immunoblots. Signal intensity of target protein is determined and is normalized by signal intensity of GAPDH. Relative signal intensity is calculated compared to control and is shown as bar diagram. Results represent the mean ± SD from three independent experiments, and * represents statistical significance based on two-tailed Student's t test (p < 0.05). B. Changes in levels of cyclin D1 mRNA in TE7 cells following transfection of pre-miR-199a-5p (10 nM) or control miR. In these experiments, 48 hours post-transfection, total RNA was extracted and levels of cyclin d1 were measured by q-PCR. Results represent the mean values of three biological and technical replicates. Error bars represents ± S.D. and statistical significance based on a two-tailed Student's t test is indicated by * (p < 0.05). C. Luciferase activity in reporter constructs containing the cyclin D1 promoter (100 ng) following co-transfection with Renilla luciferase (10 ng) and either pre-miR-199a-5p (10 nM) or control miR in TE7 cells for 36 hours. Firefly luciferase activities were normalized to Renilla luciferase activities and expressed as the mean of three independent experiments. All experiments were carried out in triplicate. Error bars represent mean ± S.D. and * represents statistically significant p < 0.05, p values based on two-tailed Student's t test. D. (a) Levels of cyclin D1 mRNA in the pull down material 48 hours following transfection with biotinylated-miR-199a-5p (50 nM) or control miR. The enrichment of miR was calculated as follows: miR pull-down/control pull-down (X), miR input/control input (Y), Fold binding = X/Y. Representative bar diagram from three independent experiments, each set of experiment was done in triplicates. Error bars represent mean ±S.D. and * stands for statistically significant based on two-tailed Student's t test where p < 0.05. (b) Levels of cyclin D1 mRNA in the total input mRNA.
