
Figure 2. Protein profile differences between Control and OM-treated RD cells.
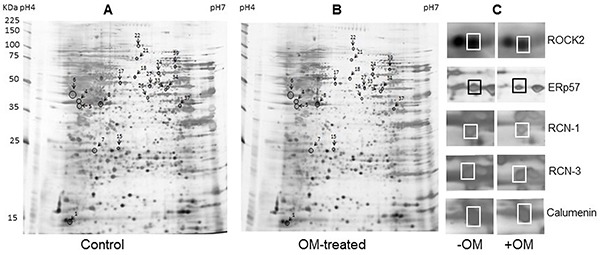
A. and B. representative silver-stained 2-DE maps of proteins from DMSO and 30 μM of OM (resolved in DMSO) treated RD cells. Fifty two differential expressed spots were picked up for MALDI-TOF-MS and MS/MS analysis. The spots of eighteen differently expressed proteins identified were marked. C. The enlarged sections of the 2-DE map. Spot 4, RCN-3; spot 5, RCN-1; spot 6, calumenin; and spot 17, ERp57.