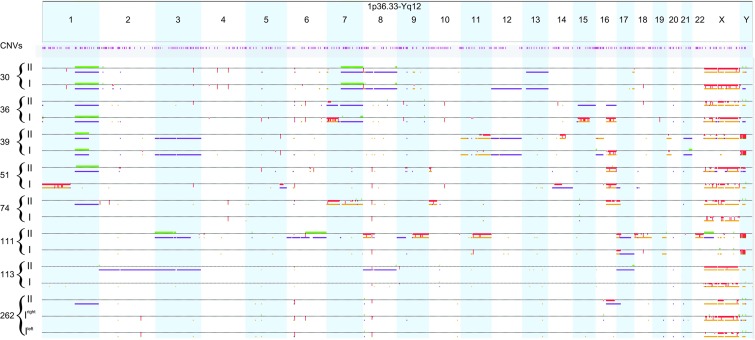
Figure 1. Whole-genome copy number and allelic ratio anomalies in the primary diseases and in their respective paired recurrences.
Along the genome, data for CN aberrations as well as AR events are displayed for each sample individually on separate rows. CN aberrations are displayed above the dotted line: CN gains are represented by green marks, CN losses by red marks. Allelic events are displayed below the dotted line: allelic imbalances by purple marks and LOH by dark yellow marks. Regions involved in homozygous copy loss are indicated by thicker red marks. The position of constitutional CNVs is indicated in pink. I: primary tumor; II: recurrent tumor.

