
Figure 4. The role of autophagy in therapeutic response after treatment of colorectal cancer cell lines with the autophagic inhibitor 3-MA.
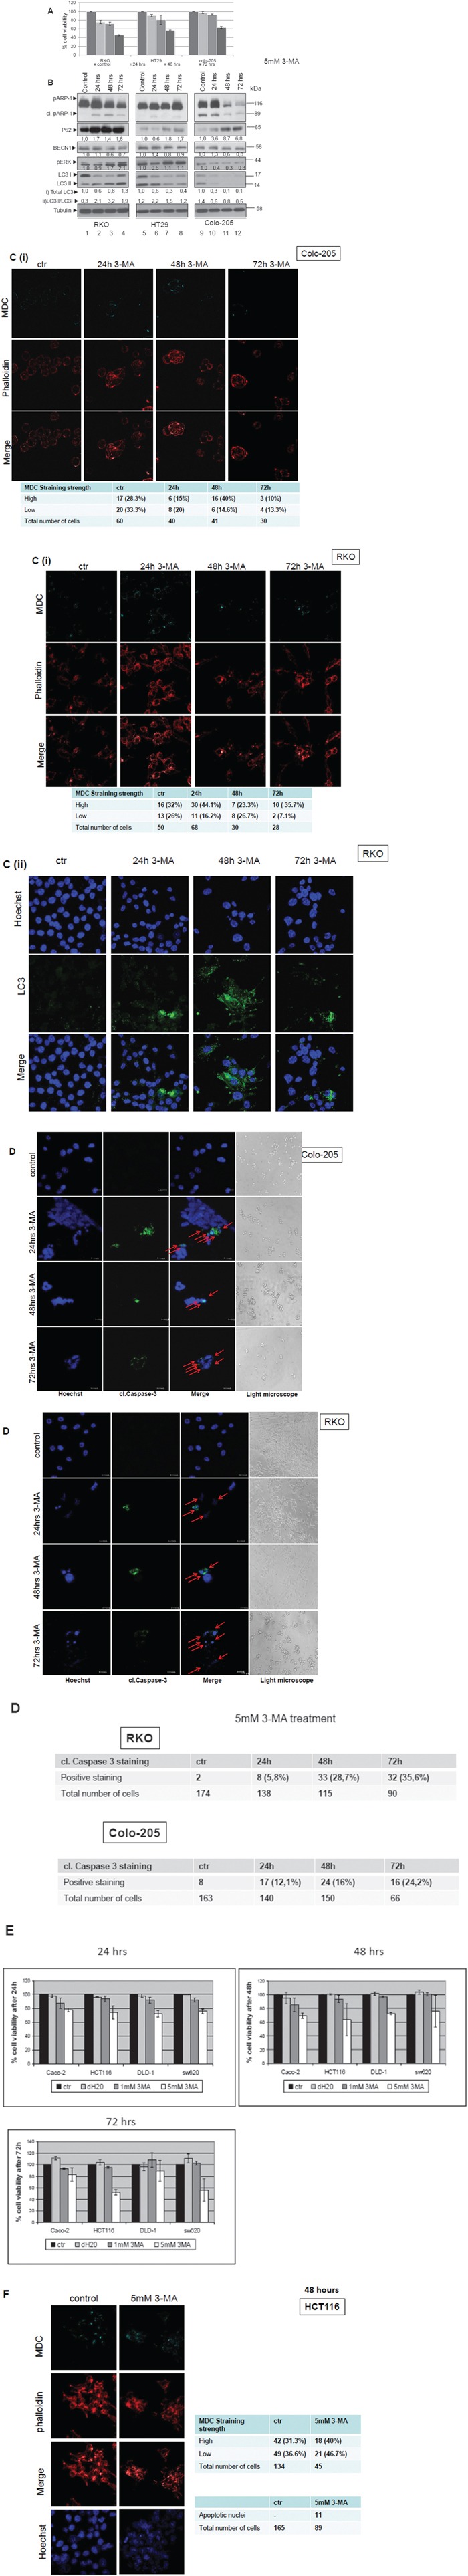
A. Cell Viability was measured, using the SRB assay, after treatment with 5mM of the autophagic inhibitor 3-MA [3-methyladenine (3-MA)] for 24, 48 and 72 h in BRAFV600E bearing cell lines RKO, HT29 and Colo-205. B. Western blot analysis after 3-MA treatment for 24 (lanes 2, 6, 10), 48 (lanes 3, 7, 11) and 72 (lanes 4, 8, 12) h: apoptotic cell death was tested by antibody against PARP (cleaved PARP), autophagy markers were evaluated by specific antibodies against LC3 I, II, BECN1 and p62. p-ERK levels were also evaluated by specific antibody. The quantification of LC3 reflects the whole protein levels as compared to the untreated sample in each cell line (i) and the ratio of LC3II/LC3I in each sample separately (ii). Protein levels were normalized against tubulin. C. The formation of autophagic vacuoles in RKO and Colo-205 cells due to treatments was determined with 0,1 mM of MDC (C(i), upper row, light blue) under confocal microscope. Cells were stained with phalloidin (C(i), middle row, red) in order to assess their number in the sample. In RKO, staining was also performed using Hoechst (4C(ii), upper row, blue), LC3 antibody (C(ii), middle row, green) and merged (C(ii), lower row). In both cases, the total number of cells and the number of stained cells from three different confocal images for each sample was recorded. D. Apoptotic marker staining under confocal microscopy for RKO and Colo-205 cells. Cells were incubated and stained with Hoechst (1st column) and with cleaved Caspase 3 antibody (2nd column) and merged (3rd column) in order to detect the presence of apoptotic cell death under confocal microscopy, after treatment with 3-MA inhibitor for 24h (2nd row), 48h (3rd row) and 72h (4th), as compared to untreated control (1st row). Cells were also visualized under optical microscope (4th column). The total number of cells and the number of cells stained with cleaved Caspase 3 from three different confocal images for each treatment was recorded. E. The effect of 3-MA on cell viability was also examined in the BRAF wild type colon cancer cell lines Caco-2, HCT-116, DLD-1 and SW620. Cell Viability was measured, using the SRB assay, after treatment with 1 and 5mM of the autophagic inhibitor 3-MA [3-methyladenine (3-MA)] for 24 (upper left panel), 48 (upper right panel) and 72 h (lower panel). F. The formation of autophagic vacuoles in HCT116 cells due to the treatment with 5mM 3-MA inhibitor was determined with 0,1 mM of MDC (light blue staining, 1st row) under confocal microscope. Cells were stained with phalloidin (middle row, red) in order to assess their number in the sample. Presence of apoptotic nuclei was detected by Hoechst staining (4th row). The total number of cells and the number of stained cells from three different confocal images for each sample was recorded.