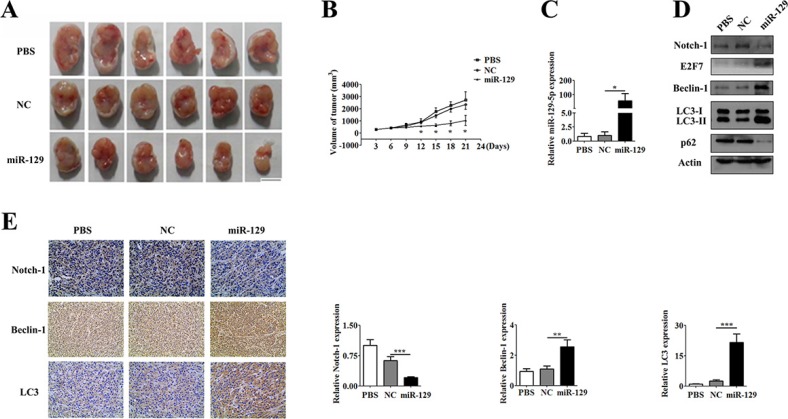
Figure 6. U87 GBM cell xenograft tumor experiment.
(A) The mice were monitored every 3 days for 3 weeks and a comparison of the sizes of the xenograft tumors were found in the different treatment groups. (B) The xenograft tumor growth curve showed an anti-tumor effect in miR-129 in vivo. Significant reduced volumes of tumor size were observed in miR-129 group compared with PBS or NC group from the 12th day after injected with lentiviruses. The volume of tumor size between PBS and NC groups had no significant difference all the time. (C) qPCR analysis of expression of miR-129 in each group of tissues (*P < 0.05). (D) Xenograft tumor tissues were tested to detect the expression of Notch-1, E2F7, Beclin-1, LC3 and p62 in PBS group or Lv-NC group or Lv-miR-129 group by Western blotting. (E) The expression of Notch-1, Beclin-1 and LC3 in each group was shown by the immunohistochemical staining of xenograft tumors. Protein expression levels of Notch-1, Beclin-1 and LC3 were evaluated by Image Pro Plus 6.0 (IPP6.0) image analysis. (mean ± SEM of 6 different horizons, **P < 0.01, ***P < 0.001).

