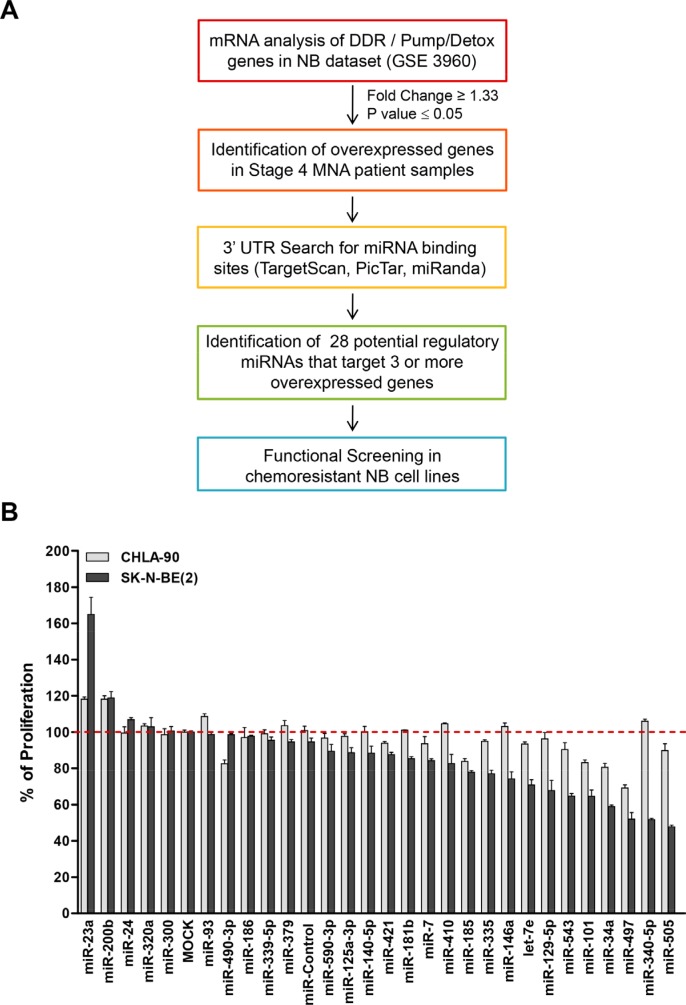
Figure 1. Functional screening of selected miRNAs.
(A) Diagram of in silico analysis carried out to select miRNAs candidates. (B) Twenty-eight different mimic miRNAs oligonucleotides were reverse-transfected in the chemoresistant NB cell lines CHLA-90 (MYCN non-amplified, gray bars) and SK-N-BE(2) (MYCN amplified, black bars). Cells were fixed and stained with crystal violet 96 h post-transfection. Absorbance was measured at 590 nm after dissolving the crystals with 15% acetic acid. Proliferation values were normalized versus MOCK-transfected cells. Data represent mean ± SEM of three independent experiments (six replicates each experiment). Statistical significance was determined by two-tailed unpaired Student's t-test comparing each miRNA versus miR-Control. P-values for the CHLA-90 cell line are miR-185: 0.00012, miR-101: 4.55 × 10−05, miR-34a: 0.00028 and miR-497: 4.13 × 10−07. P-values for the SK-N-BE(2) cell line are miR-185: 5.05 × 10−06, miR-101: 0.00311, miR-34a: 5.17 × 10⁻¹⁰ and miR-497: 0.00105.

