
Figure 7. Analysis of the possible binding interface between CD147 and AC-73.
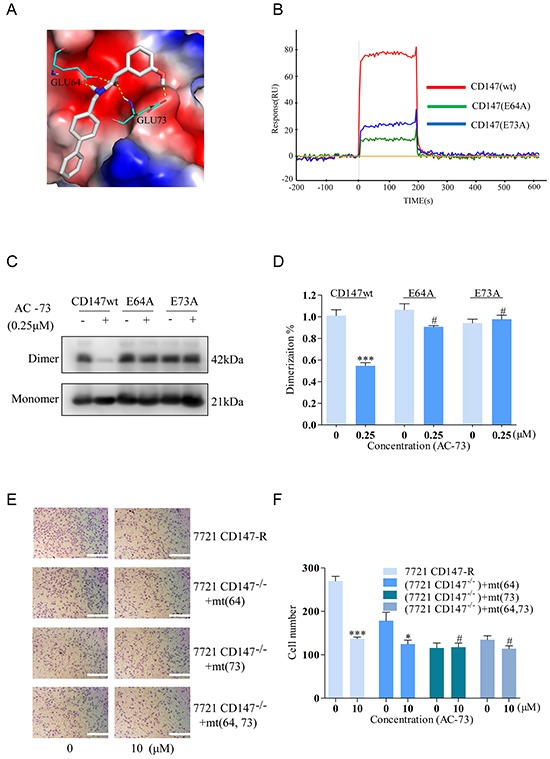
A. Simulated average complex structure of AC-73 in the N-terminal domain of CD147. B. An SPR assay was performed to evaluate the response (RU) of AC-73 to the three CD147-related proteins in a Prokaryotic expression system. The red line shows a high RU, with a representative concentration of AC-73 flowing to the CD147wt protein. The blue and green lines show the low RU, with the same concentration of AC-73 flowing to the CD147mt proteins. C. A non-denaturing SDS-PAGE assay was performed to evaluate the dimerization of the CD147wt and CD147mt proteins following treatment with AC-73 (0.25 μM). D. Quantitative analysis of the non-denaturing SDS-PAGE assay, with triplicate measurements of three independent experiments. E. A transwell assay was performed to evaluate whether migration can be influenced by AC-73 in SMMC-7721 cells expressing mutant CD147. Three mutation plasmids—pcDNA3.1-CD147 (E64A), pcDNA3.1-CD147 (E73A) and pcDNA3.1-CD147 (E64A and E73A)—together with pcDNA3.1-CD147wt were stably transfected into SMMC-7721 cells and treated with AC-73 or vehicle. Scale bars: 100 μm. F. The quantitative analysis appears as a histogram. The bars represent the mean of triplicate measurements of each sample, and the error bars indicate ± SD. ***P < 0.001, *P < 0.05, #P > 0.05, Student's t-test.