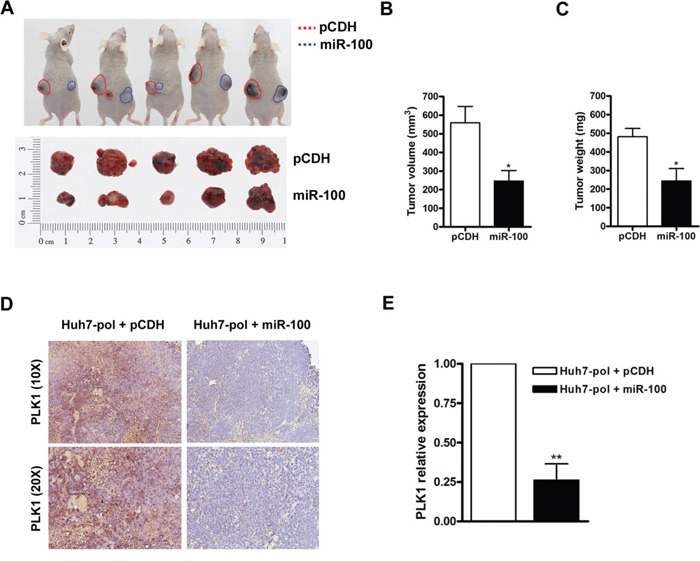
Figure 6. Suppression of tumor growth by miR-100 in Huh7-pol xenografts.

A to C. Huh7-pol cells with (blue dash line) or without (red dash line) miR-100 overexpression were subcutaneously injected into nude mice. The dissected xenograft tumors were shown (A, bottom panel). The tumor volume (B) and tumor weight (C) were calculated. Values were mean ± SD. “*”, P < 0.05. D. The xenograft tumors were subjected for PLK1 detection by use of immunohistochemistry. E. The relative expression levels of PLK1 were quantified using Aperio ImageScope system. Values were mean ± SD. “**”, P < 0.01.
