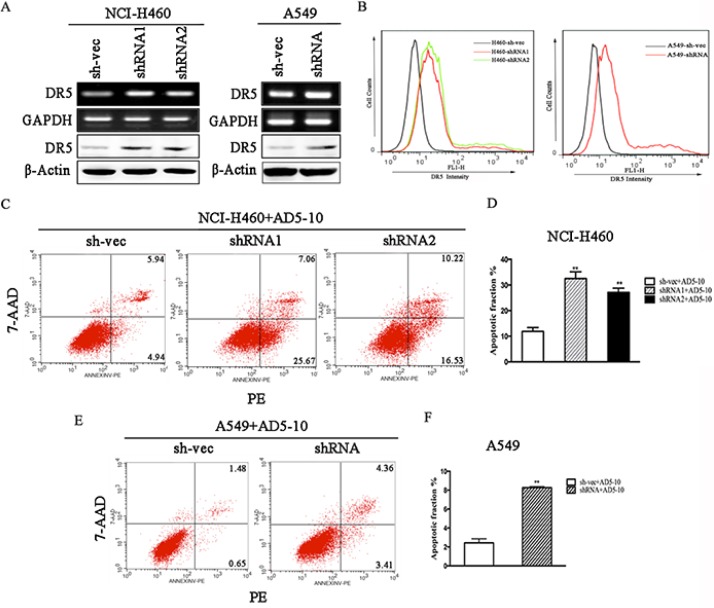
Figure 3. Knockdown of CABYR-a/b induces the expression of DR5.
Expression of DR5 was determined by RT-PCR and western blotting in CABYR-a/b-silenced H460 and A549 cells (A). Cell surface expression of DR5 was measured by immunofluorescent staining with a DR5-specific antibody and was analyzed by flow cytometry (B). The apoptotic percentage was measured using PE/7-AAD staining and analyzed by flow cytometry in CABYR-a/b-silenced and control cells treated with 200 ng/mL AD5-10 for 24 h in H460 cells and A549 cells, respectively (C, E). Histograms demonstrate the apoptotic rates within these cells. The results represent the means of at least three independent experiments (D, F). The experimental cell survival percentage was obtained in comparison with that of the respective control cells. **P < 0.01 was obtained for the comparison of the CABYR-a/b-shRNA and sh-vec groups. β-Actin was used as an internal control to ensure equal protein loading.

