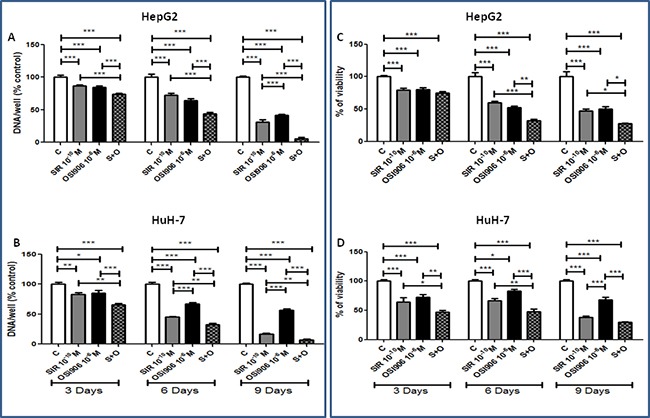
Figure 3. Antitumor effects of Sirolimus and OSI-906, alone and in combination, in both cell lines.

Since both drugs were diluted in DMSO, a double amount of DMSO was added to the control wells and the cells treated with the single agents were supplemented with an extra amount of DMSO. Data are expressed as percentage of control and represent the mean ± S.E.M. of at least three independent experiments for each cell line. Control is set as 100%. *P<0.05; **P<0.01; ***P<0.001. Drugs effects on A. HepG2 cell proliferation and on C. HepG2 cell viability, on B. HuH-7 cell proliferation and on D. HuH-7 cell viability.
