
Figure 4. Stronger reduction in replication tract length in HR-deficient compared to HR-proficient HNSCCs after combined treatment.
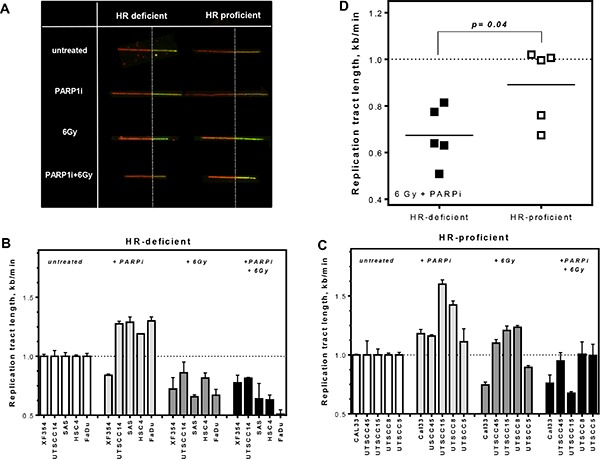
(A) Examples of replication tracts after different treatments in HR-proficient and -deficient cells. (B and C) HR-proficient and HR-deficient HNSCCs were sequentially pulse-labeled with CldU followed by IdU and replication tract length (kb/min) was calculated. Replication tract length was plotted for single as well as combined treatment, relatively to untreated controls. (D) A stronger reduction in replication tract length was observed in the HR-deficient group (p = 0.04). Statistical analysis of at least three different experiments was performed using Student's t-test.