
Figure 2. Effects of zoledronate on cell morphology and the EMT in 4 osteosarcoma (Saos2, MG-63, HOS and U2OS) cells.
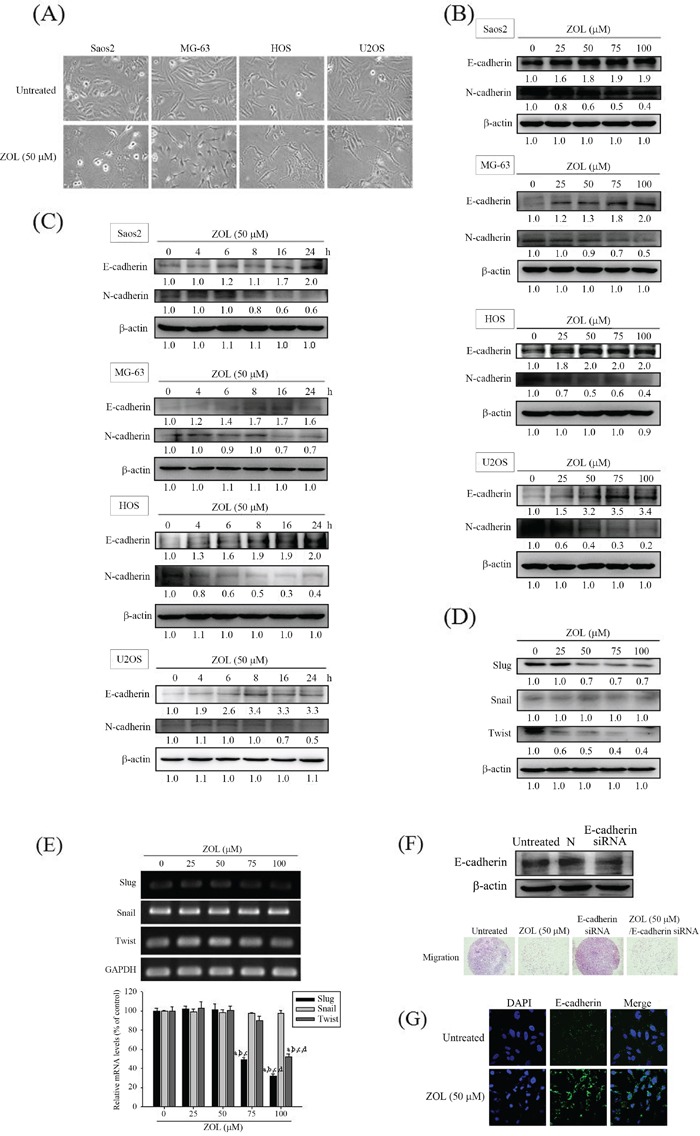
A. Cell morphology changes after 50 μM zoledronate treatment for 24 h in 4 osteosarcoma cells were observed. B. Expressions of E-cadherin and N-cadherin after different concentrations (0, 25, 50, 75, and 100 μM) and C. different time (0, 4, 6, 8, 16, 24 h) of zoledronate treatment in 4 osteosarcoma cells were measured by western blot analysis. D. Expressions and E. m-RNA levels of transcriptional factors Slug, Snail and Twist after different concentrations (0, 25, 50, 75, and 100 μM) of zoledronate treatment for 24 h in U2OS cells were measured by western blot analysis and RT-PCR, respectively. Concentration effects (Slug: F = 282.201. p < 0.001. Snail: F = 0.543, p = 0.708. Twist: F = 58.766. p < 0.001). aSignificantly different, p < 0.05, when compared with the vehicle group. bSignificantly different, p < 0.05, when compared with 25 μM. cSignificantly different, p < 0.05, when compared with 50 μM. dSignificantly different, p < 0.05, when compared with 75 μM. F. The cell migration assays after 50 μM zoledronate, siRNA E-cadherin or both treatments for 24 h in U2OS cells were measured. G. Cytoskeleton E-cadherin arrangement after 50 μM zoledronate treatment for 24 h in U2OS cells was analyzed by immunofluorescence staining.