
Figure 6. Effects of GGOH and FOH on zoledronate-suppressed α4-, α6- and β1-integrins and adhesion in U2OS cells.
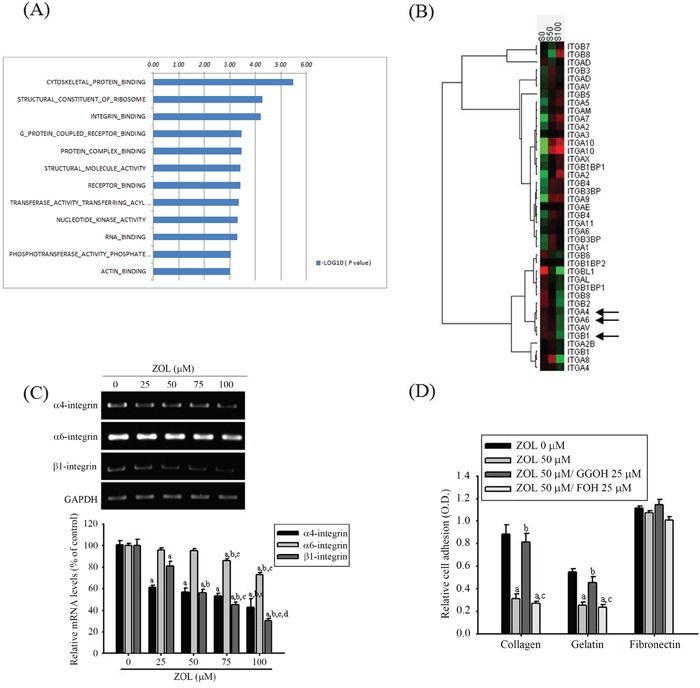
A. The geneset list of gene ontology enrichment analysis shows the enriched bar chart of cellular function categories in U2OS cells treated with 100 μM zoledronate for 6 h. Log10 ratio indicated treated U2OS cells as compared with untreated cells. B. After treating with 50 (S50) and 100 μM (S100) zoledronate in U2OS cells for 24 h, analyses of the integrin family gene expression were pooled and used to generate the heat map that shows the result of the two-way hierarchical clustering of genes and samples. Each row represents a gene and each column represents a sample. The gene clustering tree is shown on the left, and the sample clustering tree appears at the top. Increased and decreased genes are represented in red and green, respectively. ITGA4 (α4-integrin), ITGA6 (α6-integrin) and ITGB1 (β1-integrin) genes were significantly inhibited (arrow). C. U2OS cells were treated with zoledronate (0, 25, 50, 75 and 100 μM) for 24 h before being subjected to RT-PCR for mRNA expressions of α4-, α6- and β1-integrins. α4-integrin: F = 70.869, p < 0.001; α6-integrin: F = 98.511, p = 0.006; β1-integrin: F = 181.995, p < 0.001. aSignificantly different, p < 0.05, when compared with the vehicle group. bSignificantly different, p < 0.05, when compared with 25 μM. cSignificantly different, p < 0.05, when compared with 50 μM. dSignificantly different, p < 0.05, when compared with 75 μM. D. The cell adhesion assays after 50 μM zoledronate, 50 μM zoledronate plus 25 μM GGOH, or 50 μM zoledronate plus 25 μM FOH treatments for 24 h were observed in U2OS cells. Collagen: F = 74.826, p < 0.001; gelatin: F = 36.808, p < 0.001; fibronectin: F = 3.682, p = 0.062. aSignificantly different, p < 0.05, when compared with the vehicle group. bSignificantly different, p < 0.05, when compared with the zoledronate-treated group. cSignificantly different, p < 0.05, when compared with the zoledronate plus GGOH-treated group.