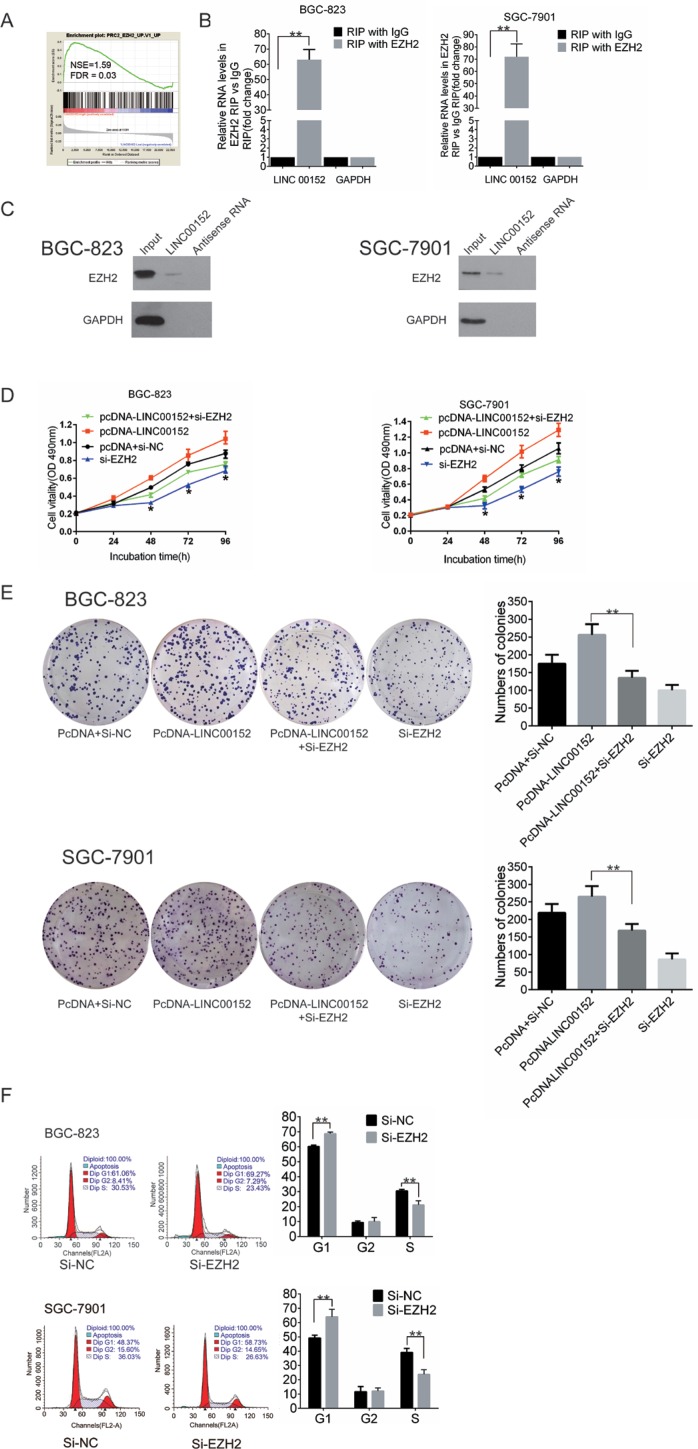
Figure 4. LINC00152 binds to EZH2.
(A) GSEA comparing the high (red) and the low (blue) LINC00152 expression GC patient groups in the GSE15459 dataset, illustrating a close correlation between expression of LINC00152 and EZH2. The enrichment score (ES, green line) indicates the degree to which the gene set is overrepresented at the top or bottom of the ranked list of genes. Black bars indicate the position of genes in the ranked list of genes included in the analysis. A positive value indicates stronger correlation with high LINC00152 expression and a negative value indicates stronger correlation with low LINC00152 expression. (B) RIP experiments were performed in BGC-823 and SGC-7901 cells, and LINC00152 levels were analyzed in co-precipitated RNA using qPCR. The fold enrichment of LINC00152 in EZH2 RIP is relative to its matching IgG control RIP (*p < 0.05, **p < 0.01. (C) An RNA pull-down assay was performed as described in the experimental procedures. LINC00152 and antisense RNA was incubated with cell extracts, and EZH2 protein was assayed by Western blot analysis. A nonspecific protein (GAPDH) is shown as the control. (D) An MTT assay was performed to measure proliferation of BGC-823 cells and SGC-7901 cells transfected with empty vector (pcDNA) + negative control (si-NC), pcDNA-LINC00152, Si-EZH2, or pcDNA-LINC00152 + Si-EZH2. (E) Colony-forming growth assays were performed to measure proliferation of BGC-823 cells and SGC-7901 cells transfected with empty vector (pcDNA) + negative control (si-NC), pcDNA-LINC00152, Si-EZH2, or pcDNA-LINC00152 + Si-EZH2. (F) Cell-cycle analysis of BGC-823 and SGC-7901 cells after transfection with siEZH2 or negative control. Summarized flow cytometry data are shown. Results are represented as the average ± SD based on 3 independent experiments (*p < 0.05, **p < 0.01).

