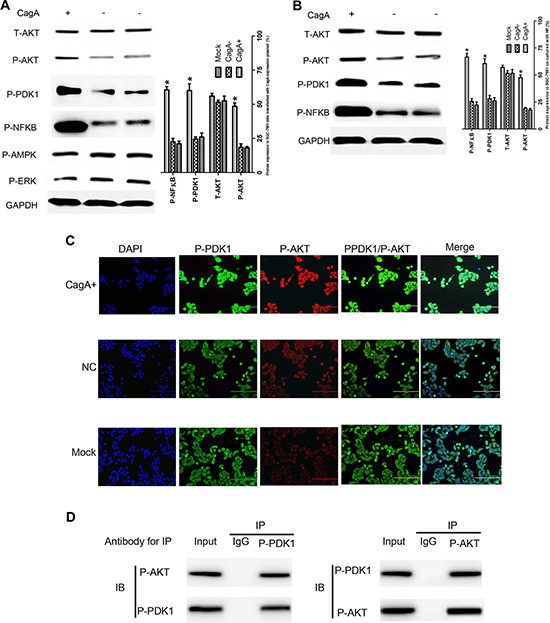
Figure 4. CagA activates AKT-NFκB pathway by enhancing the interaction of P-PDK1 and P-AKT.

(A and B) GC related signal proteins expression in differently treated cells detected by WB. P-PDK1/P-AKT/P-NFκB increases in CagA transfected or HP (MOI 100:1) cocultured cells compared with control cells. (C) Co-localization of P-PDK1 and P-AKT. The intracellular co-localization of P-PDK1 and P-AKT is analyzed using immunofluorescence microscopy. The overlay is indicated by yellow color. Data shows that the CagA group has a strong yellow signal which representes tightly interaction of P-PDK1 and P-AKT. (D) The IP test confirms the interaction of P-PDK1 and P-AKT. Data shows that P-PDK1 and P-AKT protein could be precipitated by mutual antibodies. These data suggest that CagA enhances the interaction of P-PDK1 and P-AKT. The graph represents densitometric analysis of the bands obtained for each signal. Results are expressed as relative expression compared with control cells (*p < 0.05). Each value is the mean ± SD of three experiments.
