
Figure 1.
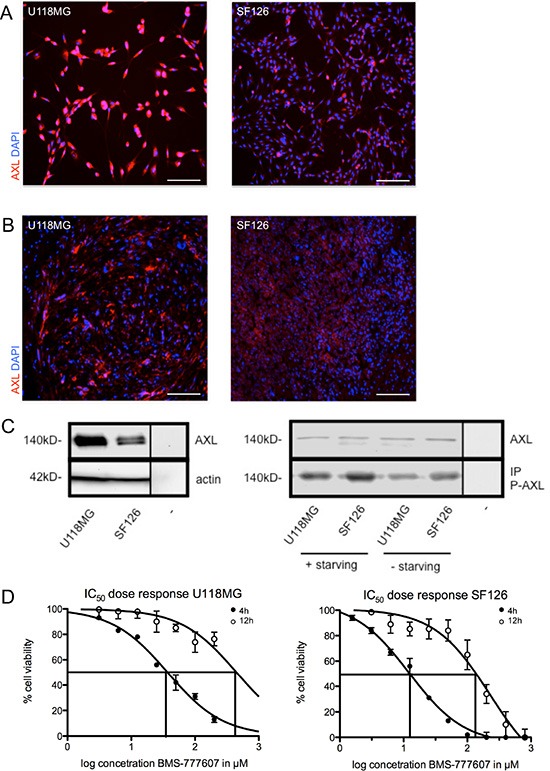
(A) RTK-AXL expression of U118MG and SF126 cells in vitro. (B) RTK-AXL expression of U118MG and SF126 xenografts in vivo. Scale bar indicates 50 μm. (C) left image: Western blot showing base line expression of RTK-AXL in cell lysates of U118MG and SF126 (− = negative control). (C) right image: Western blot analysis of changes in the phosphorylation of RTK-AXL under starving conditions compared to standard culture conditions (− = negative control). (D) IC50 of U118MG and SF126 cells after treatment with BMS-777607 for 4 and 12 hours.