
Figure 2. The identified differential metabolites between normal control (NC) and breast cancer (BC) groups.
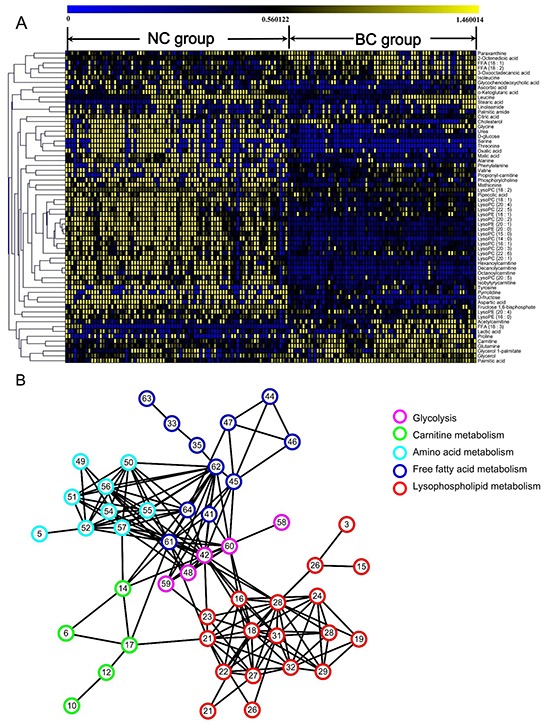
A. Heatmap of 64 differential metabolites between BC and NC participants. The colors from blue to yellow indicate the elevated amount of metabolites. B. Correlation network analysis of differential metabolites. Metabolites with high correlation coefficients were connected by lines.