
Figure 5. Combinational panel of 8 biomarkers and their diagnostic outcomes.
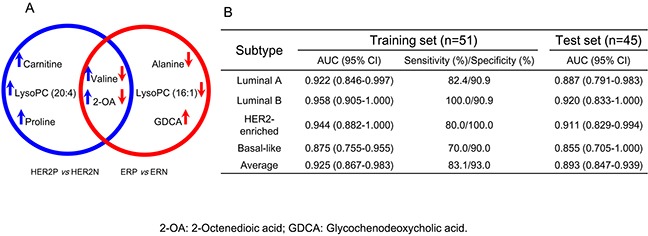
A. Venn diagram of the differential metabolites panels generated from the discrimination of different HER2 and ER statuses in breast cancer. The upward arrow represents an increased level of metabolite with the overexpression of HER2 (blue arrow) and ER (red arrow). LysoPC: lysophosphatidylcholine; 2-OA: 2-octenedioic acid; GDCA: glycochenodeoxycholic acid. B. Areas under the curve provided by the 8 biomarkers for the discrimination of BC subtypes in the training set and test set.