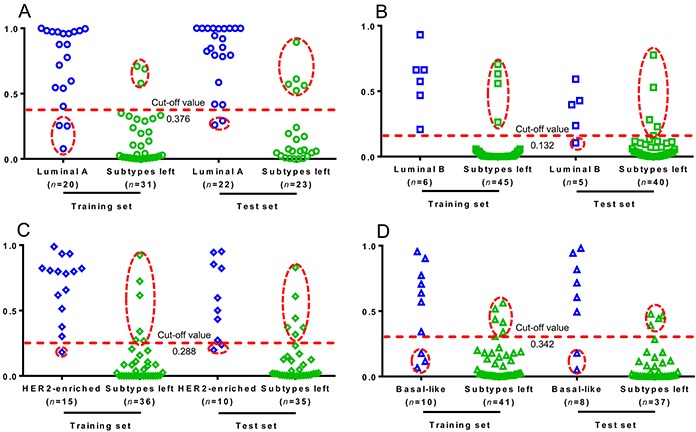
Figure 6. Prediction accuracies for BC subtypes based on the eight biomarkers.

The prediction plots based on the optimal cut-off value for A. Luminal A, B. Luminal B, C. HER2-enriched, and D. Basal-like BC subtypes. Plot in hollow dashed circle represents samples with false prediction.
