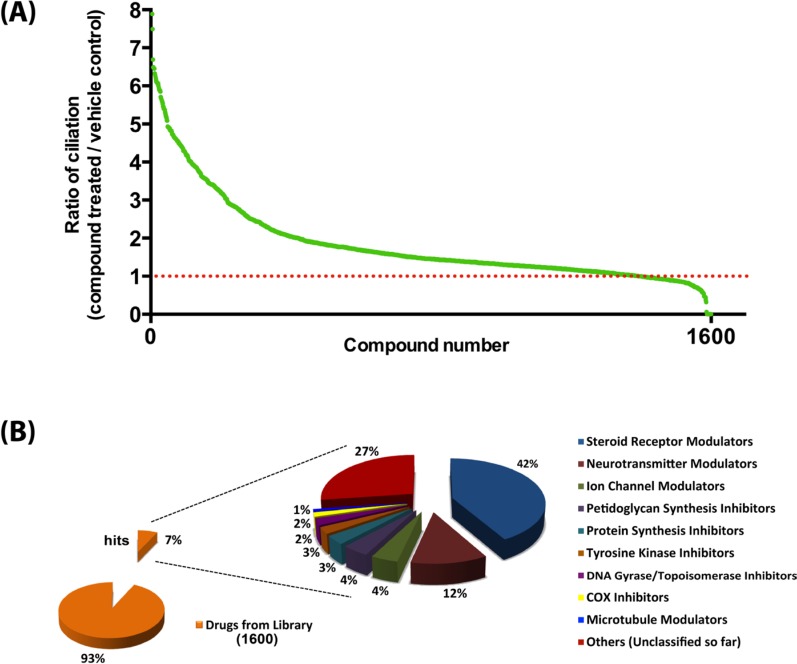
Figure 3. Summary of the outcome of the high content screen.
(A) Ciliogenic capacity of 1600 compounds of the Pharmakon 1600 library in CFPAC-1 cells using IN Cell Analyzer high content analysis. Compounds are ranked according to their potency to increase the percentage of ciliated cells relative to vehicle-treated cells (red dotted line). (B) Target diversity of confirmed hits is shown as a percentage of abundances of compounds in each class.

