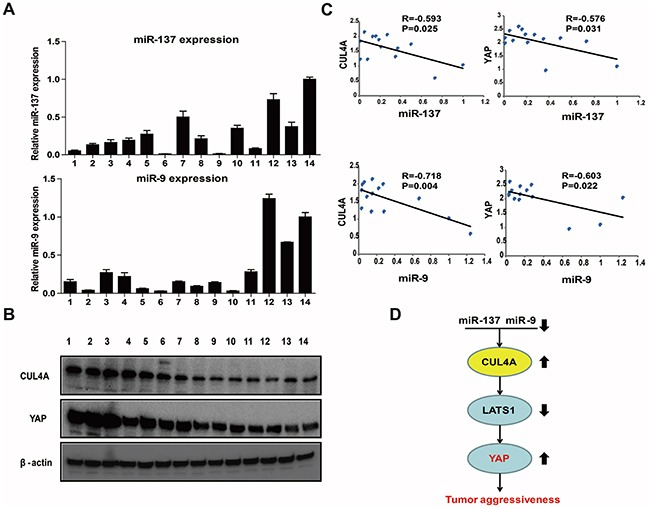
Figure 8. Clinical relevance of the miR-9/137-CUL4A-Hippo signaling axis in fresh GC tissues.

A. The relative levels of miR-9 and miR-137 expression in 14 fresh GC tissues were determined by qPCR. B. Western blotting results of CUL4A and YAP protein levels in 14 fresh GC tissues. C. Statistical analysis suggested an inverse correlation between miR-137 and miR-9 expression and CUL4A and YAP protein expression, respectively. D. Schematic of the miR-137/9-CUL4A-Hippo signaling axis in GC. Each bar represents the mean±SD of three independent experiments. (Arrows represent up or down regulation in gastric cancer cells)
