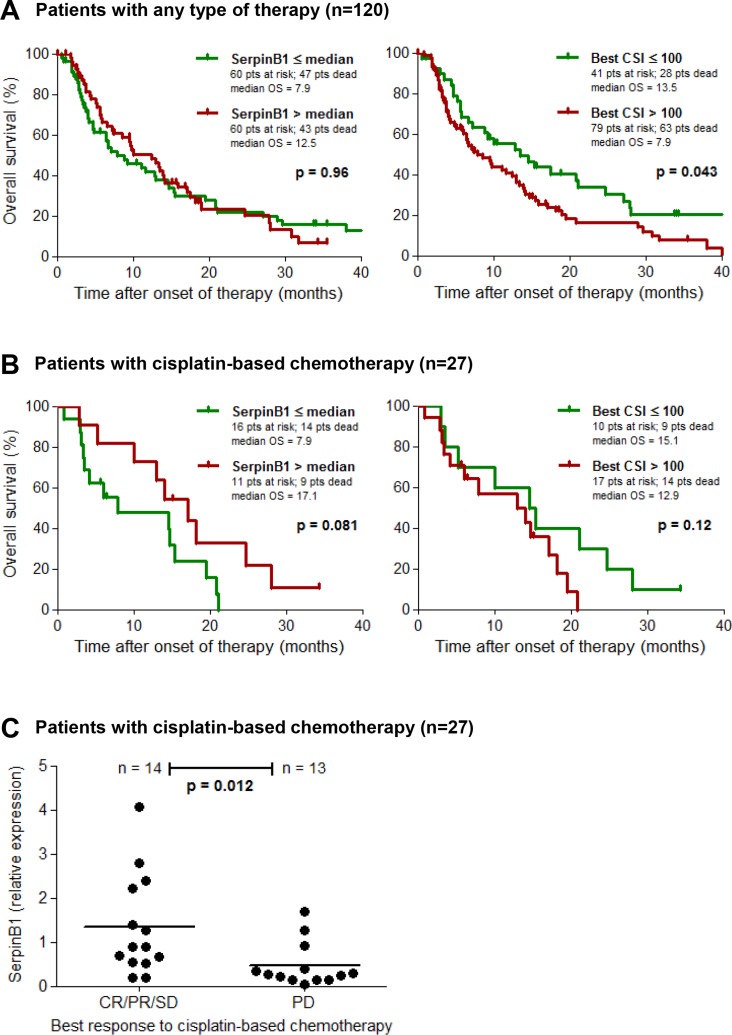
Figure 3. SERPINB1 gene expression predicts clinical outcome of cisplatin-based chemotherapy.
Kaplan-Meier plots depicting the probability of overall survival of (A) patients from validation set 1 with known clinical follow-up (n = 120) including all modes of therapy (chemotherapy, immunotherapy, other/supportive therapy), and (B) its subset of patients treated with a cisplatin-based chemotherapy regimen (n = 27). Patients are subdivided either by SERPINB1 relative gene expression in cryopreserved tumor tissues as measured by quantitative real-time PCR, or by the best chemosensitivity index (CSI) of the same tumor lesion determined on fresh tumor tissue by in vitro chemosensitivity testing. Differences between groups were calculated using the log rank test. Censored observations are indicated by vertical bars. (C) Scatter plot depicting SERPINB1 relative gene expression, measured as described above, in responders (CR/PR/SD) and non-responders (PD) of the patient subset treated with a cisplatin-based chemotherapy (n = 27). Horizontal bars represent means.

