
Figure 3. Whole genome sequencing analysis identified microbeam irradiation-induced de novo chromosomal rearrangements.
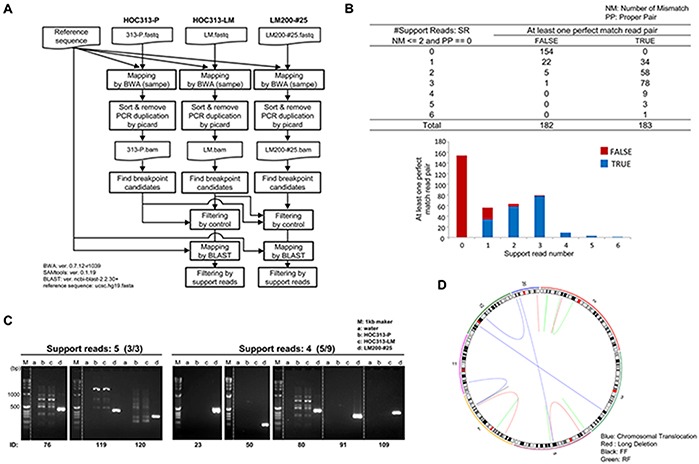
A. Identification scheme of de novo rearrangements in LM200-#25. Detailed information is described in Materials and Methods. B. The summary of support read number after filtering. Candidates of de novo rearrangements supported by ≤ 3 read pairs were regarded as true. NM: number of mismatches, PP: proper pair. C. Validation of de novo rearrangement candidates by PCR. M: 1kb marker, a: control, b: HOC313-P, c: HOC313-LM, d: LM200-#25. D. CIRCOS plots of LM200-#25, demonstrating occurrence of de novo rearrangements in chromosomes 2, 5, 7, and 20 at high frequency. Each line color represents the type of rearrangement. Blue: chromosomal translocation, Red: long deletion, Pink: forward and forward (FF), and Black: reverse and forward (RF).