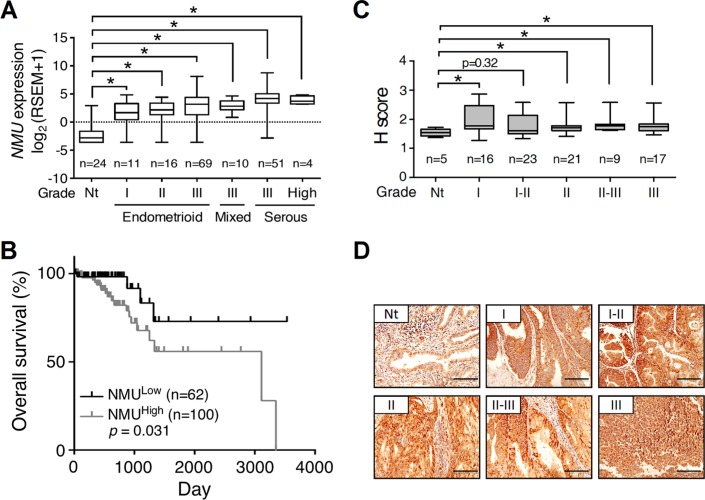
Figure 1. The expression profile of NMU and corresponding survival rate in human endometrial cancer.
(A) The values of NMU extracted from the TCGA RNA sequencing dataset were further log2 transformed by UCSC Cancer Genomics Browser and compared among normal tissues (Nt) and different grades and types of endometrial cancer. RSEM, RNA-Seq by Expectation Maximization. (B) Patient data were divided into NMUlow and NMUhigh groups according to the mean of log2 transformed NMU values. The overall survival rates were then compared between these two groups. (C) Immunohistochemical analysis of NMU in the endometrial cancer tissue microarray. The signal intensities of NMU in the different grades of endometrial cancer were analyzed by the calculation of H score. For A and C, the boxes represent the interquartile range; the horizontal lines in the boxes represent the median; the whiskers represent the minimum and maximum. *p < 0.05. (D) Represented images from the sections of normal endometrium and each grade of endometrial cancer were presented. The morphology was revealed by counter-staining with hematoxylin. Scale bars, 100 μm.

