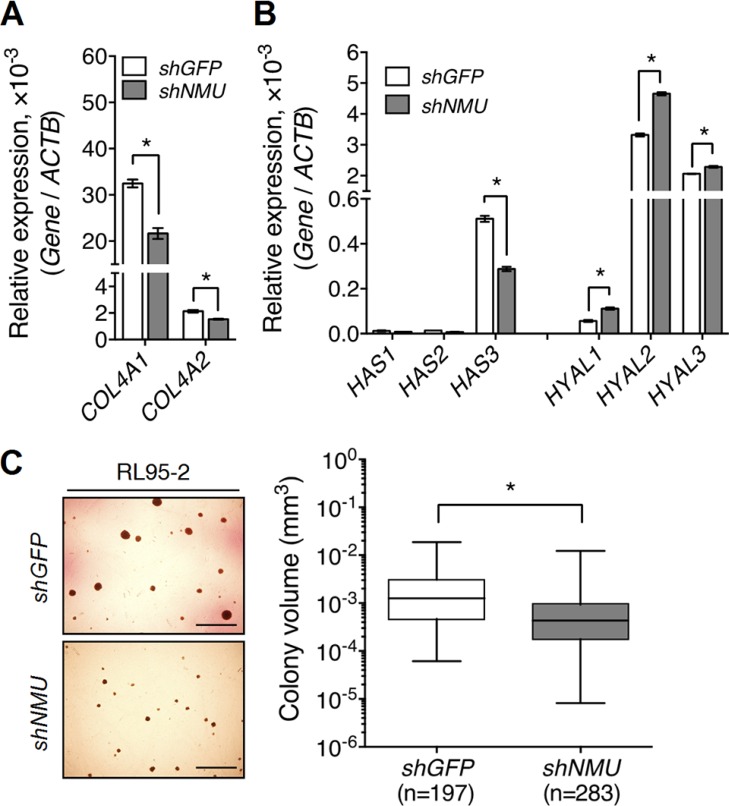
Figure 6. Knockdown of NMU decreases the expression of collagen IV and hyaluronan while at the same time reducing the anchorage-independent growth of RL95-2 cells.
The transcript levels of (A) type IV collagen genes, COL4A1 and COL4A2, (B) hyaluronan production genes, HAS1-3, and hyaluronan degradation genes, HYAL1-3, were compared between control and NMU-knockdown RL95-2 cells. The transcript of each gene was quantified by real-time PCR and then normalized against ACTB. Data are shown as the mean ± SD. *p < 0.05. (C) Control and NMU-knockdown RL95-2 cells were cultured under anchorage-independent conditions for one month. The volume of each colony formed was calculated using the equation 4/3 × π × r3. The horizontal lines in each group represent the median. Scale bar, 200 μm *p < 0.05. Represented images were shown in the left panel.

