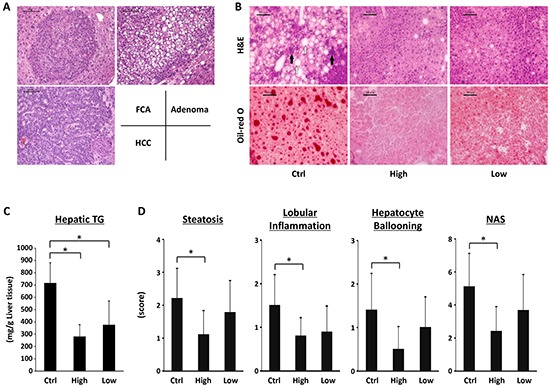
Figure 1. Effects of SA on the hepatic histopathology and intrahepatic triglyceride levels of the experimental mice.

A. Representative photomicrographs of foci of cellular alteration (FCA), liver cell adenoma and hepatocellular carcinoma (HCC). B. Representative photomicrographs of H&E staining (upper panels) and Oil-red O staining (lower panels) of liver sections from the control mice (left line), high-molecular SA-treated mice (middle line), and low-molecular SA-treated mice (right line) at the end of experiment, 21 weeks of age. Infiltration of inflammatory cells (indicated by black arrows) and ballooned hepatocytes (indicated by white arrows) were observed. Black bar: 100 μm. C. Hepatic lipids were extracted from frozen livers of the experimental mice, and triglyceride levels were measured. D. Presence of NAS (steatosis, inflammation, and ballooning) was determined using histopathological analysis. Values are expressed as mean ± SD. *P < 0.05. Ctrl; DEN-treated control group without SA administration. High; high-molecular SA-treated group. Low; low-molecular SA-treated group.
