
Figure 4. Effects of SA on expression levels of TNF-α, IL-6, F4/80 and CCL2 mRNAs in the WAT of the experimental mice.
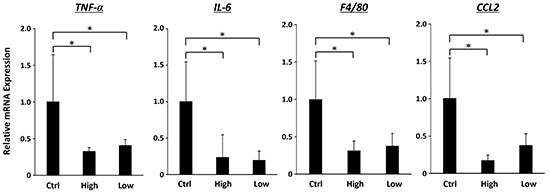
Total RNA was isolated from the WAT of experimental mice, and expression levels of TNF-α, IL-6, F4/80, and CCL2 mRNA were determined using quantitative real-time RT-PCR with specific primers. Values are expressed as mean ± SD. *P < 0.05.