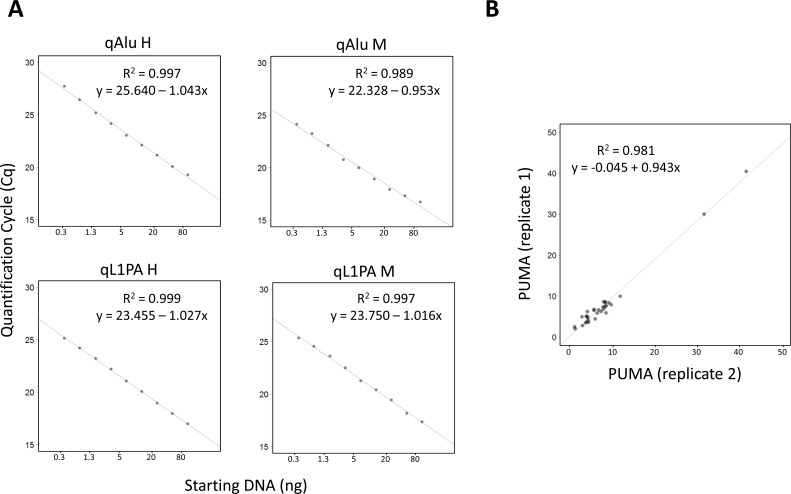
Figure 2. Evaluation of QUAlu technique.
A. Standard curves showing the linear range of the different qPCRs performed in a QUAlu assay. HCT116 genomic DNA amounts ranging from 0.3 to 80 ng were used. B. Correlation of the percentage of unmethylated Alu elements (PUMA) determined by QUAlu in two independent experiments.

