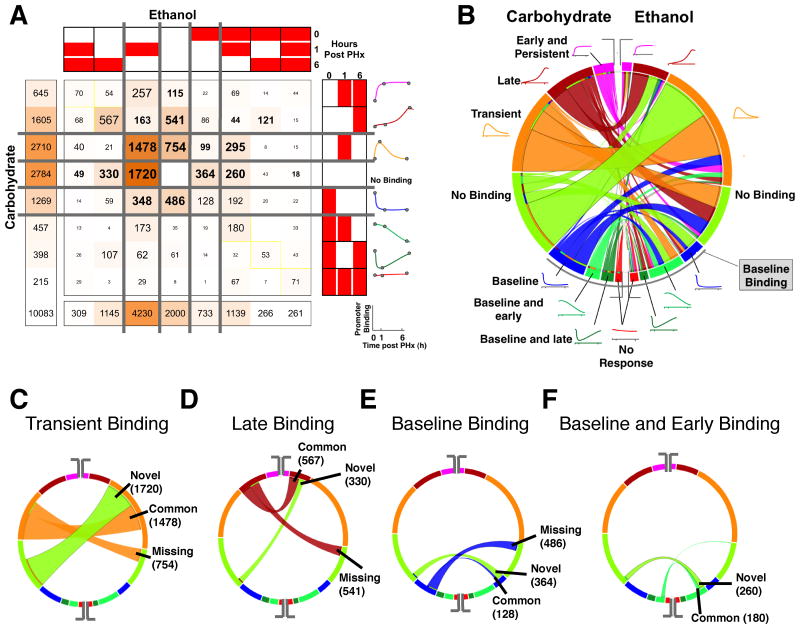
Fig. 3. Comparison of dynamic NF-κB binding patterns between the ethanol and carbohydrate control groups.
(A) COMPACT matrix showing the number of NF-κB binding targets for each combination of dynamic binding patterns between the ethanol and carbohydrate groups. The element at the ith row and jth column of the COMPACT matrix contains the number of genes that show ith NF-κB binding pattern in carbohydrate group and jth NF-κB binding pattern in ethanol group. The diagonal of the matrix represents those genes showing a common NF-κB binding response and the off-diagonal elements represent the genes showing an altered temporal NF-κB binding response between the dietary groups. The matrix was partitioned such that the patterns representing “no NF-κB binding” and “baseline NF-κB binding” separate the NF-κB binding in response to PHx. (B) A chord diagram visualization of the COMPACT matrix in A. The length of the arcs is proportional to the number of genes showing the corresponding NF-κB binding pattern. The width of the ribbons connecting the arcs corresponds to the comparative pattern count, i.e., the number of genes showing the corresponding NF-κB binding patterns in the two dietary groups. The arcs are arranged such that the “no NF-κB binding” pattern separates the patterns with and without NF-κB binding at baseline (lower and upper segements, respectively). (C-F) Select patterns are highlighted in the chord diagram to illustrate the visual analysis approach – NF-κB binding occurring only at 6h post PHx (C), only 1hr post PHx (D), at baseline (E), and at baseline and 1hr post PHx (F).

