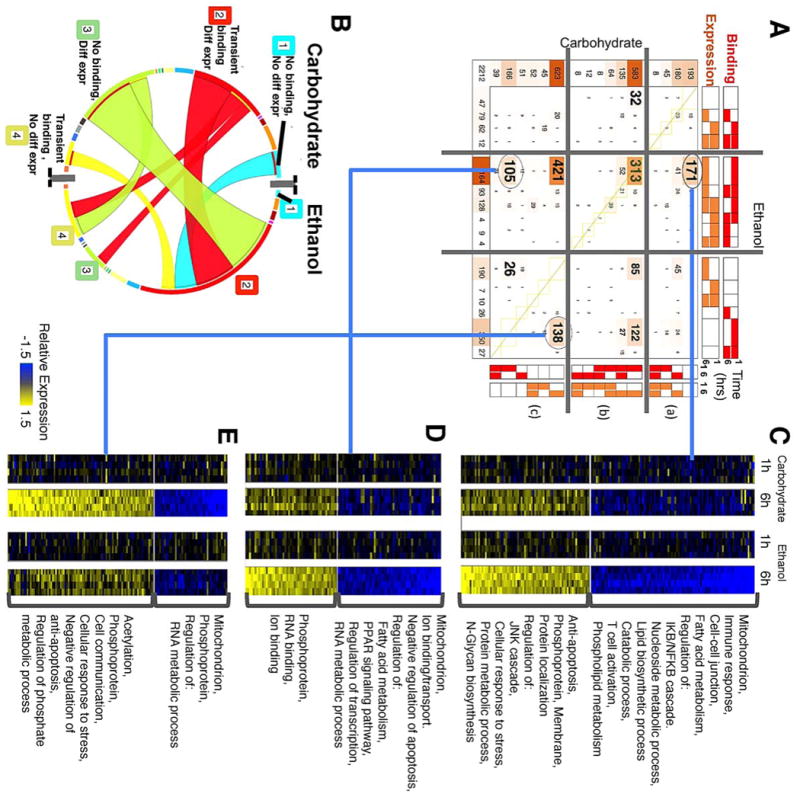
Fig. 6. Comparative pattern count analysis of the integrated NF-κB binding and gene expression data.

(A) COMPACT matrix for combined patterns of NF-κB promoter binding and differential gene expression. The matrix is separated into segments based on whether NF-κB binding and differential expression follow the same temporal pattern, occur within the 6h time frame post PHx, or are mutually exclusive, within each dietary group. In the resultant 9 segments, a few dominant patterns with relatively high number of genes are highlighted. (B) A chord diagram visualization of the patterns highlighted in A. (C-E) Differential gene expression profiles corresponding to select comparative patterns in A. (C) novel ethanol-specific binding at 1h and novel ethanol-specific differential expression, (D) common diet-independent binding at 1h and novel ethanol-specific differential expression, and (E) novel ethanol-specific binding at 1h and missing (i.e., carbohydrate-specific) differential expression, at 6h post PHx.
