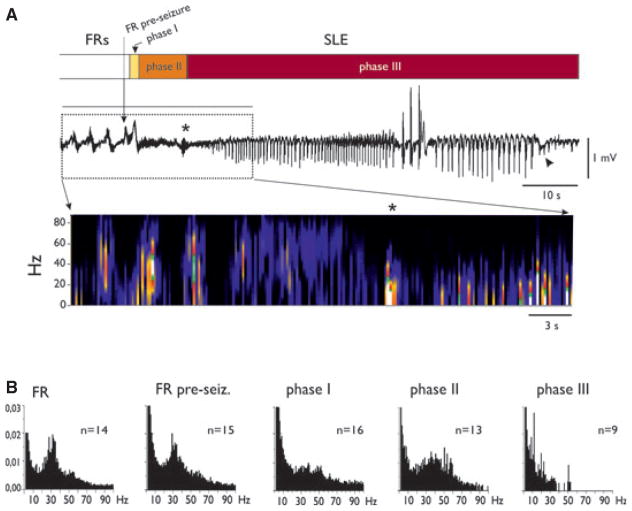
Figure 4.
Characterization of reproducible SLE phases induced in the PC by arterial perfusion of 4AP. (A) Extracellular recordings performed during an SLE. FRs and SLE phases are illustrated in the upper bar by different intensities of gray shading. The ~10 Hz activity at the transition between phase II and phase III is marked by the asterisk. The arrowhead points to the negative deflection at the end of the SLE. In the lower part of the panel the spectrogram of the SLE is illustrated. (B) Averaged fast Fourier transform plots of the recordings in different phases of the epileptiform event. Power frequency content during FRs, FRs just before an SLE (FR pre-SLE), and during phases I, II, and III of SLEs are illustrated.
Epilepsia © ILAE

