Figure 5.
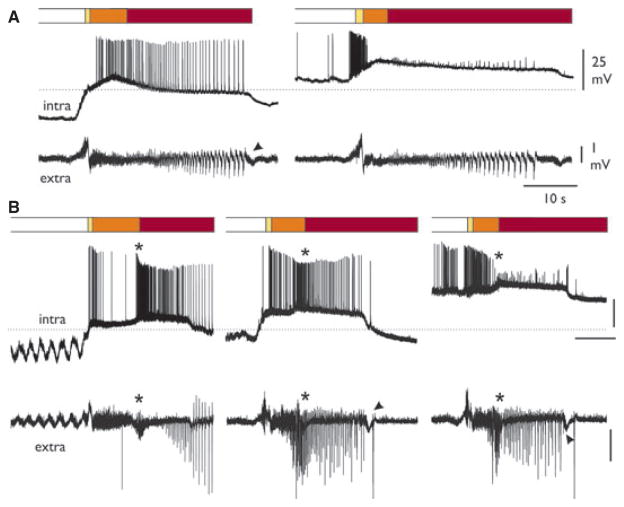
Intracellular recordings during 4AP-induced SLEs in PC layer II neurons. SLE phases are indicated by gray shadings in the upper bars (see also Fig. 4). Simultaneous intracellular (upper traces) and extracellular recordings (lower traces) are shown. (A) Intracellular recordings performed in the same layer II cell at two different membrane potentials, set by intracellular injection of either hyperpolarizing (left intra trace) or depolarizing (right intra trace) current. Resting membrane potential (dotted line) is −62 mV. (B) Intracellular recordings performed at three different membrane potential polarizations in another layer II PC neuron. Resting membrane potential (dotted line) is −56 mV. Asterisks mark the ~10 Hz activity at the transition between phases II and III. The arrowheads point to the negative deflection at the end of the SLE.
Epilepsia © ILAE

