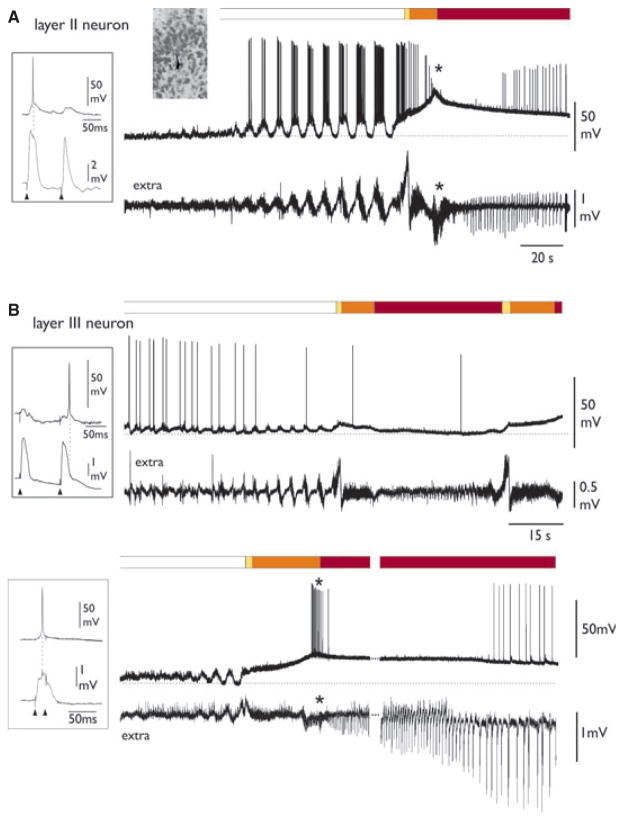
Figure 6.
Different intracellular patterns in layer II and III neurons during 4AP-induced SLEs. The phases of SLE are illustrated in the upper bars. (A) Typical intracellular SLE pattern of a layer II PC neuron, recorded simultaneously to the extracellular activity (lower trace). The asterisk marks the transition between phases II and III. Resting membrane potential (dotted line) was −70 mV. (B) Intracellular SLE pattern of two different deep layer (III) PC neurons, with simultaneous recording of the extracellular activity (lower trace). Resting membrane potentials (dotted lines) were −63 and −67 for the upper and lower neurons, respectively.
Epilepsia © ILAE

