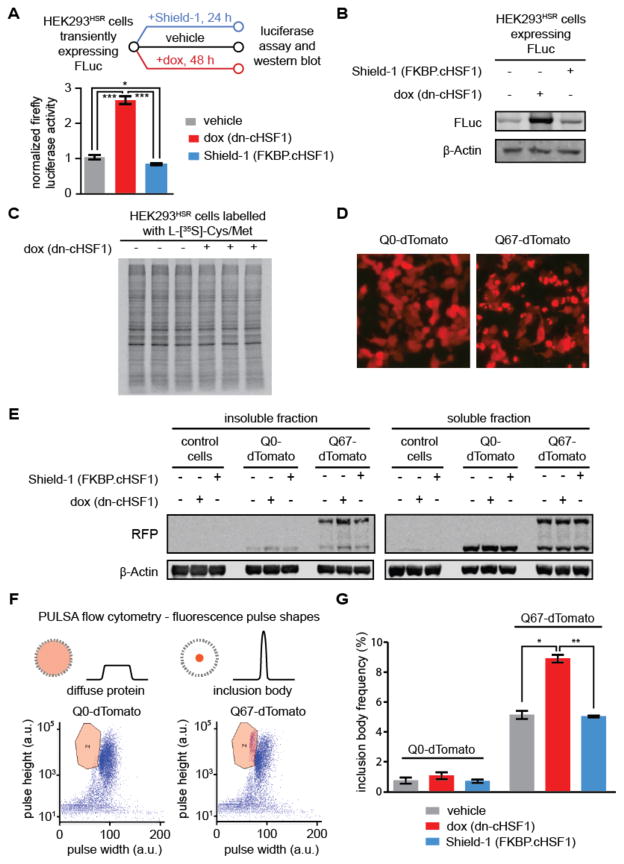
Figure 6. Effects of HSF1 inhibition and activation on the folding of a globular cytosolic chaperone client.
(A) Experimental workflow showing FLuc activity measured in transiently transfected HEK293T-RExHSR cells after treatment with vehicle, dox to induce HSF1 inhibition (1 μg/mL; 48 h), or Shield-1 to activate cHSF1 (1 μM; 48 h). Error bars represent SEM from biological replicates (n = 3). Significance was calculated using the paired Student’s two-tailed T-test. *p < 0.05, ***p < 0.005.
(B) Immunoblot to assay steady-state levels of FLuc after the treatments used in Figure 6A. (C) Auto-radiogram of [35S]-labelled protein from HEK293HSR lysates expressing dn-cHSF1 (dox; 1 μg/mL, 48 h) or no treatment prior to 15 min metabolic labelling with L-[35S]-methionine.
(D) Epifluorescent microscopy images of HEK293HSR cells transiently transfected with plasmids encoding Q0-tdTomato (left) or polyQ67-tdTomato (right)) and then treated with vehicle, dox to induce HSF1 inhibition (1 μg/mL; 48 h), or Shield-1 to activate cHSF1 (1 μM; 48 h).
(E) Immunoblot of soluble and insoluble fractions from HEK293HSR cells in Figure 6D.
(F) Diagram of PULSA flow cytometry, which utilizes fluorescence pulse height and pulse width information to identify inclusion bodies in live cells. Shown are representative plots of HEK293HSR cell populations transiently transfected with Q0-tdTomato (left) and polyQ67-tdTomato (right) treated as in Figure 6D, with gating for inclusion body population defined as the region bounded by the orange line. Purple dots in this region are defined as live cells with inclusion bodies, while all other events on the plot are defined as live cells.
(G) Quantification of inclusion body frequency measured by PULSA flow cytometry analysis of HEK293HSR cells in Figure 6E. Error bars represent SEM from 10,000 recorded live cell events performed on biological replicates (n = 3). *p < 0.05, **p < 0.01.

