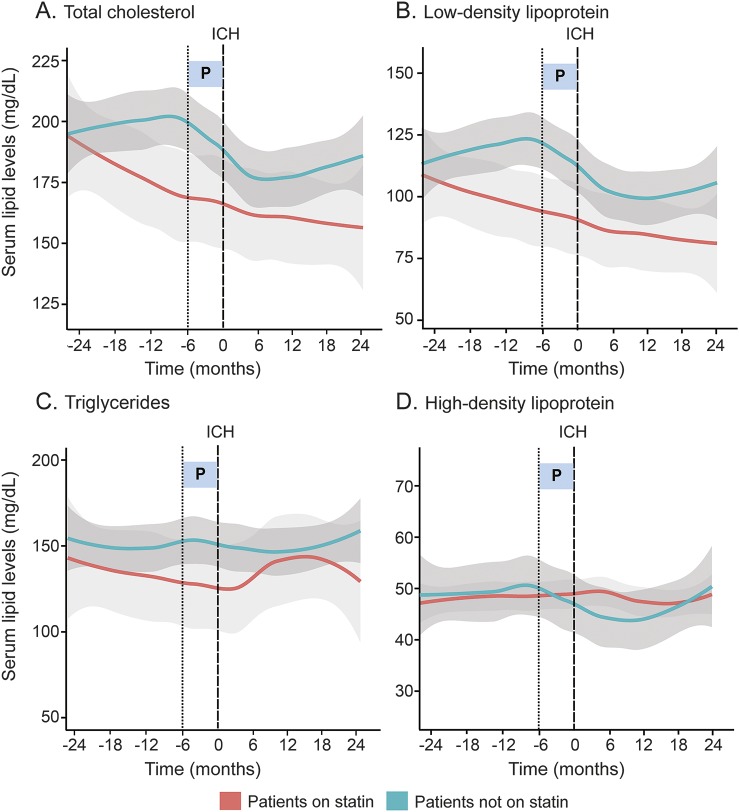
Figure 3. Serum lipid trends by statin use in patients with ICH.
(A–D) Loess smoothed curves of serum lipid levels (mg/dL) against time (in months) for comparison between ICH cases that were either on statin medication or statin-naive. (A) Total cholesterol; (B) low-density lipoprotein; (C) triglycerides; (D) high-density lipoprotein. Dark gray areas indicate SE for statin-naive ICH cases. Light gray areas indicate SE for ICH cases on statin. ICH = intracerebral hemorrhage; SE = standard error.

