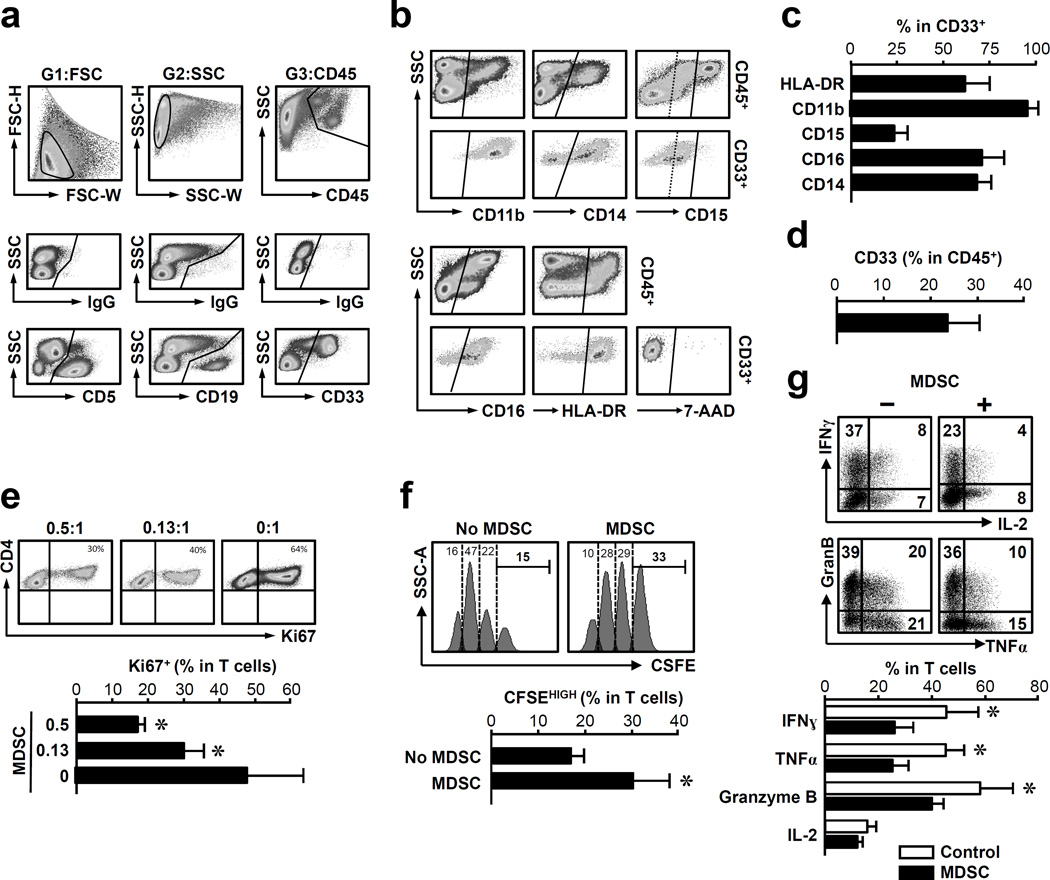
Figure 1. MDSCs are functionally relevant in human breast cancer.
(a–d) Phenotype of MDSCs. Fresh breast cancer tissues were separated into single cell suspension. The cells were stained with isotype control antibodies and relevant antibodies. Polychromatic flow cytometry analysis was performed on these cells by gating on single cells in different gates (G1–G3). (a) The relationship among CD45+, CD5+, CD19+ and CD33+ cells. Upper panels: FSC, SSC, and CD45 gates; Middle panels: isotype controls in gates 1*2*3. Lower panels: CD19, CD5 and CD33 in gates 1*2*3; (b) The phenotype of MDSCs. The expression of CD11b, CD14, CD15, CD16, HLA-DR and 7-AAD was analyzed in CD5−CD19−CD33+CD45+ cells. (c) The percentage of different antigen expressing cells in CD5−CD19−CD33+CD45+ cells. (d) The percentage of CD33 expressing cells in CD45+ cells. One of 10 representative patients is shown (a, b). Columns represent the mean ± SEM (c, d) (n = 10).
(e–g) MDSCs suppressed T cell activation. CD3+ T cells were activated with anti-CD3 in the presence of MDSCs. (e) T cells were cultured with MDSCs at different ratio (MDSC: T cell) for 48 hours. Ki67+CD3+ T cells were measured by flow cytometry. n = 3. (f) T cells were labeled with CFSE, and subsequently cultured with MDSCs. The CD3+ T cell divisions were analyzed by FACS on day 10. (g) Effector molecules were detected in CD3+ T cells by intracellular staining and analyzed by FACS. MDSC: T cell ratio was 0.5:1 (f, g). n = 4, *P < 0.03, Wilcoxon pair test.

