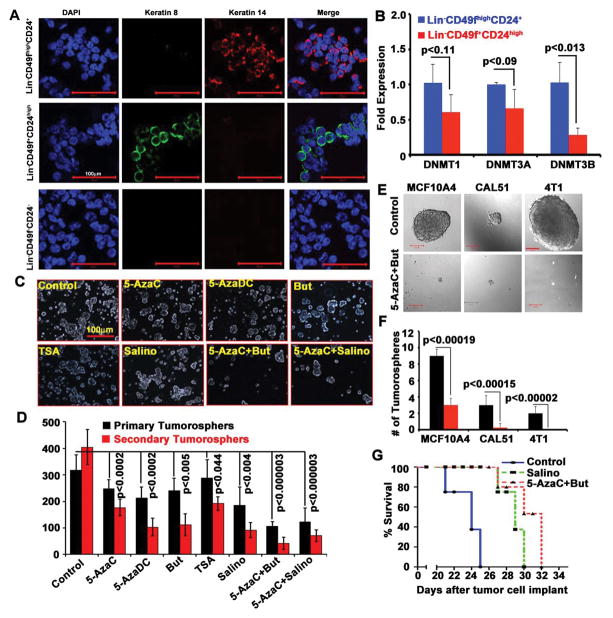
Figure 3.
Treatment with DNMT and HDAC inhibitors restricts CSCs. A, Representative confocal images (25x) of keratin 14 (red), keratin 8 (green) and DAPI (blue) expression in sorted myoepithelial stem cells, luminal progenitor cells, and stromal cells showing free of cross contamination (n=5 mice). B, Real-time PCR showing the relative levels of DNMT1, 3A and DNMT3B expression in myoepithelial stem and luminal progenitor cells. Data represent mean ± SD for 5 mice. C, Representative tumorospheres images (10x) of control and treated (as indicated) for seven days. D, Quantification of primary and secondary tumorospheres derived from control and treated groups. Data represent mean + SD of 3 mice with quadruplicate wells (n=12 samples). E–F, Tumorosphere size and number in MCF10A4, CAL51, and 4T1 cells with or without treatment (5-azaC+But). G, Survival curve for mice: 4T1 cells were injected into mammary fat pad of Balb/c mice and then treated with and without 5-AzaC+But and salinomycin (n=5 mice in each).

